Download
1 / 36
360 likes | 450 Views
Welcome To the AVO International Meter Adapter Recorder Presentation. This Presentation will Take about 15 Minutes Click the Right Arrow Button or Press Enter to Advance. AVO International Meter Adapter Recorders. High Performance Power Monitoring For Light Commercial/Residential Sites.

E N D
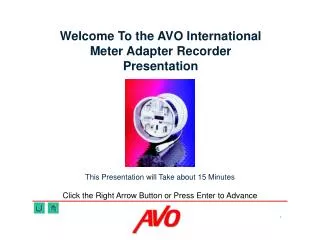
Welcome To the AVO International Meter Adapter RecorderPresentation This Presentation will Take about 15 MinutesClick the Right Arrow Button or Press Enter to Advance
AVO InternationalMeter Adapter Recorders High Performance Power Monitoring For Light Commercial/Residential Sites
Requested By Many Utilities • Meter Adapter Recorder Capable of Measuring Voltage and Current of Electrical Service at Meter • Current Values Help Determine Source of Problem(System Side or Load Side) • Safe (no external wires/boxes) • Convenient (Meter Forms 2S, 12S, 25S) • Extremely Easy To Use
State of The Art Technology • High Speed DSP (Digital Signal Processor) • 256 Samples/Cycle Sample Rate • Flash Memory • Easy Field Upgrades (Enhancements, etc). • Upgrade in Minutes (By You) vs. Days (Factory) • Universal Meter Adapter • 190 A Ring/Ringless • Optically Isolated RS232 Port • Don’t Lose Your Neutral and Feed 120vac to Your Laptop!
= Exclusive Feature Ground Clip- Must be connected to neutral in meter base
= Exclusive Feature • Descriptive LED’sIndicate ProblemsWhile ConnectedTo The ServiceMonitored Ground Clip
= Exclusive Feature • Descriptive LED’sIndicate ProblemsWhile ConnectedTo The ServiceMonitored • RemovableJaw to 6 or 9O’Clock Positions(Network Meters) Ground Clip
= Exclusive Feature • Descriptive LED’sIndicate ProblemsWhile ConnectedTo The ServiceMonitored • RemovableJaw to 6 or 9O’Clock Positions(Network Meters) Ground Clip Manual ON/OFF Switch
= Exclusive Feature • Real Time Display Toggles Between L1, L2 and Countdown Time to Start Recording- Indicates Unit Is Working Properly • Descriptive LED’sIndicate ProblemsWhile ConnectedTo The ServiceMonitored • RemovableJaw to 6 or 9O’Clock Positions(Network Meters) Ground Clip Manual ON/OFF Switch
Easy to Install and Use Pull The Meter
Easy to Install and Use Plug in the Meter Adapter Recorder
Easy to Install and Use Plug Meter Into Meter Adapter Recorder and Attach Seal
Easy to Install and Use DONE!!
Parameters Measured • 2 Line-Neutral Voltages • Calculated L-L Voltage (By adding 256 Samples/Channel) • Works For 120/240v or 120/208v Services • 2 Line Currents (L1 & L2) Captive Integral CT’s • Calculates Neutral Current (Subtract 256 Samples/Line Current)
Operation • You Specify Recorder Response Time, or How Often TRMS Values are Calculated(1 - 60 cycles) • You Specify Data Storage Interval(1 cycle to 4 Hours) • Recorder Automatically Computes TRMS Value per Selected Response Time and Storage Interval
Operation • Recorder Stores Highest, Lowest TRMS Value in Storage Interval as Well as TRMS Value over Storage Interval • Result: You Capture Highest/Lowest 1 Cycle Events/Storage Interval Regardless of Storage Interval Length • This is the 1st Type of Continuous Recording
Out Of Limits Recording • This is the 2nd Type of Simultaneous Recording • Based On Limits You Set, Recorder will Separately Start Logging Events in the Out Of Limits Report as Soon as They are Detected • Limits Can be Set for: Swells/Sags, THD, Spikes as Fast as 65 microsec (1/256th of a cycle)
Limit Value • THD Limits Type of Limit • Subcycle Transient Limit Turn Limit ON • = Exclusive Feature Use Included 32-Bit, Windows Software to Set Limits
R Recording/Not Recording N Suspected Loose Neutral þ F Flicker Events þ H Harmonic Events þ S Swell/Sag/Sub-Cycle Events • = Exclusive Feature Indicating LEDs • At a Glance, External Indicating LED’s (þ) Tell You if any Events Occurred During the Test. • The GE Flicker Table and a Special Loose Neutral Algorithm are Used.
= Exclusive Feature Ease Of Use & Flexibility • Display Tells Installer Unit Is Working And Will Record Correct Values • Countdown Time (Programmable) Tells User Time Before Recording Will Start • Many Different Ways To Start Recordingþ
Voltage Present Starts Recording Specify Starting Date,Time and Length (Hours) Current Present Starts Recording Specify Recording Start Delay Time StartRecording With Manual Switch
5 - Click on Create!! 4- Select Trace Colors 1- Select the datafile you Wish to Chart 2- Select Type Of Chart 3- Select Items To Chart Generating Charts with AVO-Metrosoft is a Snap!
And Here It Is! Ready to Print, Export, or Cut-and-Paste into a Document or SpreadsheetThis is a 19 Day Recording - Notice the Outage
Outage To Zoom, just hold down the mouse button, drag the cursor to box in the area of interest, release and ZOOM!
Power Quality/Power Flow Options • Two Key Options are Available at a Low Cost • Power Quality Option Captures Waveforms Based on Event (Surge/Sag, THD, Sub-Cycle) Trigger or Time Trigger • You can See Disturbances, Select Waveforms and Do Harmonic Analysis • By Capturing Post-Trigger Cycles, You can See how the Disturbance Resolved Itself
Power Quality Option: Waveform Capture/Harmonic Analysis- Here is a lighting strike in the vicinity of this residence
1 - Select a Waveform with the Cursor 2 - Click on Create for a Harmonic Analysis Harmonic Analysis
Detailed Harmonic Analysis Selected Waveform Harmonic Summary And Here Is The Harmonic Analysis!!
PF KVAH KWH Power Flow Option:Record all Key Power Parameters, Investigate Billing Complaints, Even Look at Vector Relationships
Reports • AVO-Metrosoft Can Automatically Generate Many Different Reports For You: • Tabular Reports (basic raw data) • Out of Limits Reports (Event Data) • Weekly Energy Report (a whole single week for any one selected demand parameter) • Voltage Regulation Report
Note that Power by phase as well as total, and also true pf,displacement pf, voltage and current imbalance per demand interval are presented. Tabular Report: Demand
Event Summary with type of event Event Details Out of Limits Report (Event Data)
Summary • Why have we built so much power into a residential unit? • Because Power Quality Problems Have Found Their Way into The Home • Many Home Offices with Sensitive Equipment and UPS’s/Surge Arrestors • Chips in Many New Appliances • To Protect Your Investment • With De-regulation, Power Quality Problems in the Home/Light Commercial are Going to Get Worse, Not Better
Summary, Continued • mr-2/4 Using Advanced Technology Offer: • Ease of Use, Flexibility, Versatility • Fast, Easy Field Upgradeability • Users can Start with the Simplest Unit and Add Power Quality and/or Power Flow Options when and if They Want to Make Their Unit Almost into a Full Blown Powerline Disturbance Analyzer
Thank you for Viewing our Meter Adapter Recorder Presentation. For More Information Contact Your Local Representative or Call AVO International at 800-723-2861 www.avointl.com