Download
1 / 65
650 likes | 838 Views
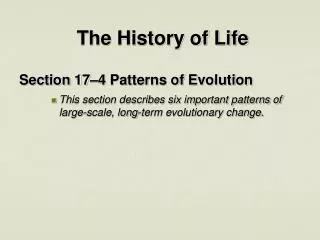
Some major episodes in the history of life. Trends in Ecology & Evolution. Feb. 2003. Vol. 18, Iss. 2. 3 of these 5 are the most downloaded papers in TREE. 1. Taxonomy: renaissance or Tower of Babel? Jim Mallet et al 4. A plea for DNA taxonomy Tautz et al

E N D
Trends in Ecology & Evolution Feb. 2003. Vol. 18, Iss. 2 3 of these 5 are the most downloaded papers in TREE 1. Taxonomy: renaissance or Tower of Babel? Jim Mallet et al 4. A plea for DNA taxonomy Tautz et al 5. The encyclopedia of life Edward Wilson
DNA barcoding a new diagnostic tool for rapid species recognition identification, and discovery New Scientist, 26 June, 2004 James Hanken, Museum of Comparative Zoology, Harvard University, USA
Barcoding is a standardized approach to identifying plants and animals by minimal sequences of DNA, called DNA barcodes. DNA Barcode: A short DNA sequence, from a uniform locality on the genome, used for identifying species. BARCODING LIFE Mark Stoeckle, The Rockefeller University; Paul E. Waggoner, Connecticut Agricultural Experiment Station; Jesse H. Ausubel, Alfred P. Sloan Foundation
By harnessing advances in electronics and genetics, barcoding will • help many people quickly and cheaply recognize known species and retrieve information about them • speed discovery of the millions of species yet to be named • provide vital new tools for appreciating and managing the Earth’s immense and changing biodiversity. • Standardization • accelerate construction of a comprehensive, consistent reference library of DNA sequences • speedy development of economical technologies for species identification. • The goal is that anyone, anywhere, anytime be able to identify quickly and accurately the species of a specimen whatever its condition. • Results so far suggest that a mitochondrial gene will enable identification of most animal species. • For plants, mitochondrial genes do not differ sufficiently to distinguish among closely related species. Promising approaches to standardize plant identification use one or possibly more barcode regions are under development.
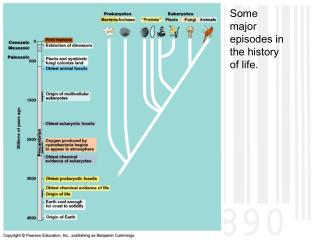
Small ribosomal RNA The Mitochondrial Genome D-Loop mtDNA DNA Cytochrome b ND1 ND6 ND5 COI ND2 COI L-strand H-strand Typical Animal Cell ND4 ND4L COII ND3 COIII ATPase subunit 8 ATPase subunit 6 Mitochondrion An Internal ID System for All Animals
Why barcode animals with mitochondrial DNA? Mitochondria, energy-producing organelles in plant and animal cells, have their own genome. Twenty years of research have established the utility of mitochondrial DNA sequences in differentiating among closely-related animal species. Four properties make mitochondrial genomes especially suitable for identifying species * Greater differences among species • Copy number. There are 100-10,000 more copies of • mitochondrial than nuclear DNA per cell, making recovery, • especially from small or partially degraded samples, easier • and cheaper. • Relatively few differences within species in most cases. Small intraspecific and large interspecific differences signal distinct genetic boundaries between most species, enabling precise identification with a barcode. • Introns, which are non-coding regions interspersed between coding regions of a gene, are absent from mitochondrial DNA of most animal species, making amplification straightforward. Nuclear genes are often interrupted by introns, making amplification difficult or unpredictable.
ND1 ND2 ND3 COIII How Barcoding is Done From specimen to sequence to species Collecting DNA extraction CO1 gene DNA sequencing Trace file Database of Barcode Records Voucher Specimen
What are the main limits to barcoding encountered so far? • Groups with little sequence diversity • Resolution of recently diverged species • Hybrids • Nuclear pseudogenes
What do barcode differences among and within animal species studied so far suggest? • Barcodes identify most animal species unambiguously. • Approximately 2-5% of recognized species have shared or overlapping barcodes with closely-related species. Many of the species with overlapping barcodes hybridize regularly. • In all groups studied so far, distinct barcode clusters with biologic co-variation suggest cryptic species.
Barcoding North American birds highlights probable cryptic species
Barcodes affirm the unity of the species Homo sapiens. Comparisons show we differ from one another by only 1 or 2 nucleotides out of 648, while we differ from chimpanzees at 60 locations and gorillas at 70 locations.
Can barcodes aid understanding history of animal and plant species?
What isn’t DNA barcoding? • It is not intended to, in any way, supplant or invalidate existing taxonomic practice. • It is not DNA-taxonomy; it does not equate species identity, formally or informally, with a particular DNA sequence. • It is not intended to duplicate or compete with efforts to resolve deep phylogeny, e.g., Assembling the Tree of Life (ATOL).
“the role of any molecular diagnostic is to aid research, not to serve as an end in itself. Barcoding … is independent of questions as to whether individual taxa are species, what species are (or should be), and where they fit in a unified tree of life…. Barcoding is not an end in itself, but will boost the rate of discovery. The unique contribution of DNA barcoding to … taxonomy and systematics is a compressed timeline for the exploration and analysis of biodiversity.”
Sequence data Voucher specimens and electronic databases Digital images Barcoding must adhere to standards for specimen and data management
Strengths • Offers alternative taxonomic identification tool for situations in which morphology is inconclusive. • Focus on one or a small number of genes provides greater efficiency of effort. • Cost of DNA sequencing is dropping rapidly due to technical advances. • Potential capacity for high throughput and processing large numbers of samples. • Once reference database is established, can be applied by non-specialist.
Weaknesses • Assumes intraspecific variation is negligible, or at least lower than interspecific values. • No single gene will work for all taxa (e.g., COI is not appropriate for vascular plants, or even for some animals). • Single-gene approach is less precise than using multiple genes; may introduce unacceptable error. • Some of the most attractive aspects rely on future technology, e.g., handheld sequencer
ID all species Won’t work Destroy traditional systematics Discover new species Speed up ID’s Service industry Revitalize biological collections Pseudo taxonomy Simple & Ambitious! Advocates Opposition
Making Every Species Count A global science project ► 5 years ►5M specimens ►500K species
Official launch of iBOL – CN Tower, Toronto, September 25, 2010
iBOL structure: participating nations Central Nodes ($25M) Regional Nodes ($5M) National Nodes ($1M)
ICI is an alliance of researchers and biodiversity organisations in 21 nations. All nations active in specimen assembly, curation and data analysis. Sequencing and informatics support by regional and central nodes. Central Nodes Regional Nodes Developing Nodes Collection and Databasing Curation and Identification Sequencing MirroredDatabases Data Analysis and Access
Theme 1:DNA Barcode Library WG1.1 Vertebrates WG1.2 Land Plants WG1.3 Fungi WG1.4 Animal Parasites, Pathogens & Vectors WG1.5 Agricultural & Forestry Pests & Parasitoids WG1.6 Pollinators WG1.7 Freshwater Bio-Surveillance WG1.8 Marine Bio-Surveillance WG1.9 Terrestrial Bio-Surveillance WG1.10 Polar Life
Bringing genomics to the fight against plant pests and invasive species • Assembling a DNA barcode reference library of pests and their parasitoids • 2015 target: 25,000 of the most important pest species iBOL WG 1.5
BENEFITS OF DNA BARCODING • DNA barcoding can speed up identification of new species. • DNA barcodes can be linked to readily observable morphological characters. • DNA barcoding can provide an avenue to encourage new participants into taxonomy. • Applied taxonomic research areas will benefit from barcoding. • Food adulteration
Barcode of Life Community Networks, Projects, Organizations • Promote barcoding as a global standard • Build participation • Working Groups • BARCODE standard • International Conferences • Increase production of public BARCODE records
CBOL Member Organizations: 2009 • 200+ Member organizations, 50 countries • 35+ Member organizations from 20+ developing countries
GenBank, EMBL, and DDBJGlobal, Open Access to Barcode Data NBII, 25 February 2009 http://www.insdc.org/
BARCODE Records in INSDC Specimen Metadata Voucher Specimen Species Name Geo referenceHabitatCharacter setsImagesBehaviorOther genes Indices - Catalogue of Life - GBIF/ECAT Nomenclators - Zoo Record - IPNI - NameBank Publication links - New species Barcode Sequence Trace files Primers Other Databases Literature(link to content or citation) PhylogeneticPop’n GeneticsEcological Databases - Provisional sp.
Linkout from GenBank to BOLD NBII, 25 February 2009
Linkout from GenBank to Taxonomy NBII, 25 February 2009
Link from GenBank to Museums NBII, 25 February 2009
Current Norm: High throughput Large labs, hundreds of samples per day Large capacity PCR and sequencing reactions ABI 3100 capillary automated sequencer
Emerging Norm: Table-top LabsFaster, more portable: Hundreds of samples per hour Integrated DNA microchips Table-top microfluidic systems
Producing Barcode Data: 201?Barcode data anywhere, instantly • Data in seconds to minutes • Pennies per sample • Link to reference database • A taxonomic GPS • Usable by non-specialists
Adoption by Regulators • Food and Drug Administration • Reference barcodes for commercial fish • NOAA/NMFS • $100K for Gulf of Maine pilot project • FISH-BOL workshop with agencies, Taipei, Sept 2007 • Federal Aviation Administration – $500K for birds • Environmental Protection Agency • $250K pilot test, water quality bioassessment • FAO International Plant Protection Commission • Proposal for Diagnostic Protocols for fruit flies • CITES, National Agencies, Conservation NGOs • International Steering Committee, identifying pilot projects
Establishing a DNA Barcode for Land plants Santiago Madriñán Restrepo Universidad de los Andes, Bogotá, Colombia samadrin@uniandes.edu.co
COI or cox1 in Plants • Low sequence divergence • Other mitochondrial genes • Exhibit incorporation of foreign genes • Frequent transfer of some genes to the nuclear genome
Barcode representation of DNA fingerprints of Indian CASHEW varieties (Archak et al 2003
Molecules and their useful rangesin phylogenetic relationships Species Genera Family Order Class Divisions Spacers [ITS] mt DNA Nu rDNA ; more sufficient statistically significant results ; sufficient statistically significant results Taylor, et al., 1991
Other Regions • Internal transcribed spacer regions of nuclear ribosomal DNA (ITS) • often highly variable in angiosperms at the generic and species level • divergent copies are often present within single individuals • Non-coding plastid regions • Highly length variable • rbcL ( • Not variable enough at species level for many plant groups • Plastid DNA • Monomorphic • High copy number • Highly diagnostic
Sister taxa: Cattleya and Sophronitis “Corsage orchids” Cássio van den Berg Universidade Estadual de Feira de Santana, Brasil Cattleya: 43 spp. in 2 subgenera Unifoliate species = 18 species, allopatric species “complex” Bifoliate species = 25 well-defined species, 6 species pairs Sophronitis: 63 spp. in 3 subgenera (as “sections”) Sect. Cattleyodes+Hadrolaelia – 17 well-defined species Sect. Parviflorae – 40 spp. messy complex, genetic data indicate ca. 15 spp. Sect. Sophronitis – 6 allopatric closely related species C.labiata C. aclandiae S. perrinii S. sp. nov.
% species discriminated Nuclear non-coding Plastid non-coding • ITS: 90.5% • psbA-trnH: 60% • matK: 33.3% • ndhJ: 37.1% • rpoB: 9.9% • rpoC1:9.9% • accD: 6.05 % Plastid coding • accD, rpoB, rpoC1: variation too low for use as a single barcode • matK and ndhF: more variable but with great variation of rate among subgenera • Non-coding regions (ITS and psbA-trnH spacer) performed better, but required great manual effort for indel alignment
Lauraceae • Big family • Largely unstudied • VERY difficult to id. • Economically important