Download
1 / 12
120 likes | 220 Views
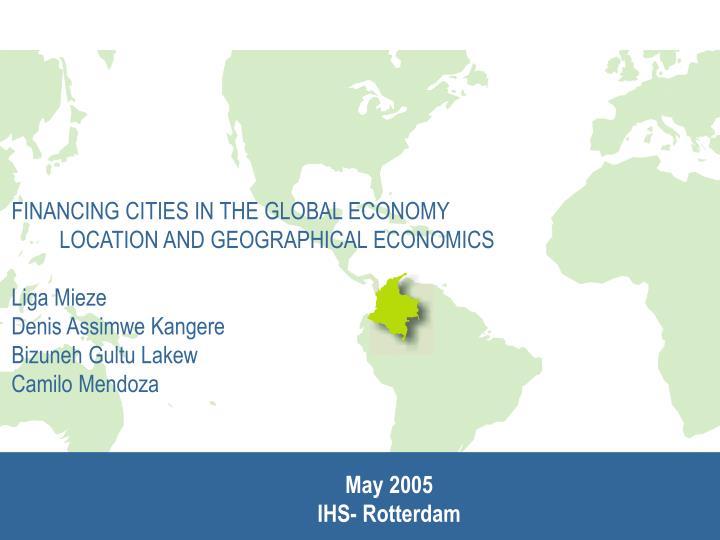
FINANCING CITIES IN THE GLOBAL ECONOMY LOCATION AND GEOGRAPHICAL ECONOMICS Liga Mieze Denis Assimwe Kangere Bizuneh Gultu Lakew Camilo Mendoza. May 2005 IHS- Rotterdam. Colombia General Information. Mid Point between North and South America 2 Oceans: Atlantic & Pacific

E N D
FINANCING CITIES IN THE GLOBAL ECONOMY LOCATION AND GEOGRAPHICAL ECONOMICS Liga Mieze Denis Assimwe Kangere Bizuneh Gultu Lakew Camilo Mendoza May 2005 IHS- Rotterdam
Colombia General Information • MidPoint between North and South America • 2 Oceans: Atlantic & Pacific • Spanish language Source: Biological Resources Investigation Institute Alexander Von Humboldt, 2000
Colombia General Information • Why Colombia? • Because of its location ~ could be a bridge between North and South America • In negotiation a Free Trade Treaty with USA • Analysing a Latin American Country • 1,141,748 km2 inland – 928.660 km2 on water • Population: 46 million • 72% in cities Source: IGAC
Urbanisation Colombia turned from a mainly rural country to an urban one in the last half century as a result of: • industrialization / diversification of exports (mining products) • agriculture technology improvement • development of third sector activities • rural violence • high birth rates • revenue concentration
Monteria Bucaramanga Medellin Tunja Pereira Buenaventura Cali Pasto • 36% of the population live in the selected cities Source: Dane
Simulation Assumptions • Delta 0.67 reflects the percentage of expenses on manufacturing • Epsilon as provided by model • Tau(congestion parameter) small deviation & large deviations used • Stop criterion and adjustment speed as provided by the model • Initial distribution of mobile& immobile workers based on the population • Distances based on time of travel between the different cities
Scenario 1 • With tau at 0.2 and transport cost fixed at 1.3,we observe a tendency to spread
Scenario2 • With tau increased to 0.3 and transport cost still fixed at 1.3,we observe a tendency to spread to the cities to the far right
Scenario 3 • With tau at 0.4 and transport cost fixed at 1.3,we observe a tendency to spread
Conclusions • City 12(Tunja) tends to attract the mobile workers as the congestion increases • Promote policies that improve the connectivity of the other cities