Download
1 / 30
300 likes | 452 Views
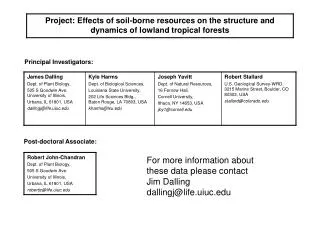
Principal Investigators: William C. Malm 1 Jeffrey L. Collett, Jr. 2 Authors: Michael G. Barna 1 Kristi A. Gebhart 1 Bret A. Schichtel 1 Contributors:. Katie Beem 2 Christian M. Carrico 2 Derek E. Day 3 Jenny L. Hand 3 Sonia M. Kreidenweis 2 Taehyoung Lee 2 Ezra Levin 2

E N D
Principal Investigators: William C. Malm1 Jeffrey L. Collett, Jr.2 Authors: Michael G. Barna1 Kristi A. Gebhart1 Bret A. Schichtel1 Contributors: Katie Beem2 Christian M. Carrico2 Derek E. Day3 Jenny L. Hand3 Sonia M. Kreidenweis2 Taehyoung Lee2 Ezra Levin2 Charles McDade4 Gavin R. McMeeking2 John V. Molenar5 Suresh Raja2 Marco A. Rodriguez3 Florian Schwandner2 Amy P. Sullivan2 Courtney Taylor2 1National Park Service CSU/CIRA Fort Collins, Colorado 80523-1375 2Department of Atmospheric Science Colorado State University Fort Collins, Colorado 80523-1371 3Cooperative Institute for Research in the Atmosphere (CIRA) Colorado State University Fort Collins, Colorado 80523-1375 4Crocker Nuclear Laboratory University of California Davis, California 95616-8569 5Air Resource Specialists Fort Collins, Colorado 80525 ISSN 0737-5352-84
PARTICIPATING AGENCIES, INSTITUTIONS, AND COMPANIES • FEDERAL GOVERNMENT AGENCIES • NPS • NOAA • USGS • USFS • EPA • STATE OF COLORADO • Colorado State University • Colorado Department of Public Health and Environment • CONTRACTORS • Air Resource Specialists • University of California • Desert Research Institute • Research Triangle Institute
Reduced Nitrogen Compounds OXIDIZED NITROGEN N O Nitrogen Dioxide (NO2) Nitrate (NO3) N REDUCED NITROGEN H Ammonium (NH4) Ammonia (NH3)
Sources of Reduced and Oxidized Gases Compound Anthropogenic Naturally Occurring NO2 NO3 Fossil-Fuel Combustion (power plants- mobile sources-oil and gas) Fertilizer, Prescribed fire Soil Release Lightning Wild fire NH3 NH4 Feedlots - Fertilizer Wild animals – Ecosystem respiration Organic N Feedlots Vegetation
Concerns about N deposition • Low capacity to sequester atmospheric N deposition • N enrichment and shifts in diatom communities in alpine lakes • N enrichment in organic soil layer and Engelmann spruce needles on eastern slope See Fenn et al. (2003) for review of N deposition ecological effects
Increasing Wet Nitrogen Deposition Wet nitrate concentration deposition trends Wet ammonium concentration deposition trends
ROMANS OBJECTIVES • Characterize the atmospheric concentrations of sulfur and nitrogen species in gaseous, particulate and aqueous phases (precipitation and clouds) along the east and west sides of the Continental Divide (Organic Nitrogen?) • GAS: NH3, R-NH2, NOX(NO+NO2), NOY(HNO3, PAN, etc) • PARTICLE: NH4, NO3,ORGANICS (reduced and oxidized)? • WET (rain, snow, and clouds): NH4, NO3, ORGANICS (reduced and oxidized)? • Identify the relative contributions to atmospheric sulfur and nitrogen species in RMNP from within and outside of the state of Colorado. • Identify the relative contributions to atmospheric sulfur and nitrogen species in RMNP from emission sources along the Colorado Front Range versus other areas within Colorado. • Identify the relative contributions to atmospheric sulfur and nitrogen species from mobile sources, agricultural activities, large and small point sources within the state of Colorado.
Colorado Front Range Upslope Events H L Mountain-valley winds can draw air from eastern urban corridor and plains up into mountains Synoptic Scale high and low pressure systems
Background:Historical deposition Observations from weekly monitoring networks NADP (wet) CASTNet (dry) Deposition peaks in the spring and summer months Wet deposition accounts for 65–80% of measured total Limitations No dry NH3 measurements No organic N measurements
Grant, NE Dinosaur Loch Vale Beaver Meadows Timber Creek Brush Core Site Gore Pass Lyons Springfield STUDY DESIGN
RoMANS measurements • Core site • co-located with IMPROVE/CASTNet sites • Particle composition • 24 hr PM2.5 ions (URG) • 15 min PM2.5 ions (PILS) • Particle size distributions and scattering • DMA, OPC, APS + nephelometer • Gases • 24 hr NH3, SO2 and HNO3 (URG) • Continuous NOx, O3, CO, NH3 • Wet deposition • Event and sub-event/hourly • Meteorological • Other network sites • 24 hr PM2.5 ions and trace gases (URG) • Wet deposition
Measured Spring Ammonia, Ammonium, and Wet Deposited Ammonium Measured Summer Ammonia, Ammonium, and Wet Deposited Ammonium
Contribution of Dry and Wet Deposited N Species to Total Measured N depositions • N Deposition is ~2/3 wet (rain and snow) and 1/3 dry (particles and gases). • ~1/2 of N deposition is due to reduced N; 1/3 oxidized; and 15% organic N • Over 30% of N deposition is not being measured in the current monitoring programs (NADP & CASTNET).
Apportionment Strategy (Weight of Evidence) • Concentration gradients. • Which way is the wind coming from? • Simple back trajectories. • Frequency with which the air mass passes over source areas before it arrives at the receptor -residence time analysis. • Trajectory receptor models. • Receptor models. • Chemical transport models. • Hybrid Models.
Spring overview Concentrations lower in mountains Gases dominate at eastern and western sites Highest ammonia at Brush in NE Colorado Particles dominate in mountains
Statistical Analysis of Many Trajectories (Residence Time) Trajectories on a day with elevated NHx, NO3 and SO4 Incremental residence time analysis: Transport on the 10% highest NH3 hours compared to every hour during the spring Rocky Mountain NP 5-day back trajectory starting April 23rd, 2006
NH3 Source regions • National scale emissions divided into numerous source regions • Regional scale model used to simulate transport of emissions from each region NOx
Emission weighted transport from each source region to RMNP was modeled Northeastern CO Western CO Central CA Examples of simulated transport of “inert” ammonia to the Rocky Mountain Region from three source regions
Estimated from CAMX tracer run Hybrid Model Source contributions are estimated by statistically relating transport from source regions to RoMANS field observations “Combine the power of the models for simulating transport with the accuracy of measurements for determining RMNP nitrogen species concentrations and deposition fluxes”
Detailed Deposition Source Attribution Budgets • Spring N deposition is primarily from northeastern CO and Denver • Summer N deposition is from a diverse set of sources • Local sources contribute ~15% of summer NH3 deposition
REPRESENTIVENESS Full Year of Monitoring at Rocky Mountain
N Deposition in Other Seasons Dec-Feb, 2009 N dep=3.2 mg/m2/wk Mar-Apr, 2009 N dep=9.2 mg/m2/wk • Winter has different deposition composition, but the lowest deposition rates • In general, RoMANS I was representative of 2009 Jun-Aug, 2009 N dep=8.7 mg/m2/wk Sep-Nov, 2009 N dep=6.8 mg/m2/wk Annual N dep=2.9 kg/ha/yr
Trace Nitrogen Gas Samplers (off the shelf and custom) Measure Other N compounds including organic N
Incorporate Gaseous Organic N into Deposition Budget • Assumed R-NHx dry deposition velocity = NH3 • Total N deposition = 6 kg/ha/yr • Assumed R-NHx dry deposition velocity = NH3 / 5 • Total N deposition = 4 kg/ha/yr
N compounds from fires? Carrico et al., • On September 6th and 7th, 2010, the RMNP monitoring site was impacted from smoke from the Boulder Fourmile Canyon fire • During this episode NH3 and other N compounds (organic N) increased