Questionnaire design 2.8 Design a questionnaire
450 likes | 762 Views
Questionnaire design 2.8 Design a questionnaire. Anna Martin mar@avcol.school.nz Jacob Le Roux lrx@avcol.school.nz Avondale College. Common perceptions?. Students (and some teachers). Taken from: A guide to good survey design (Statistics NZ, 2005). S tudents. Teachers maybe.

Questionnaire design 2.8 Design a questionnaire
E N D
Presentation Transcript
Questionnaire design2.8 Design a questionnaire Anna Martin mar@avcol.school.nz Jacob Le Roux lrx@avcol.school.nz Avondale College
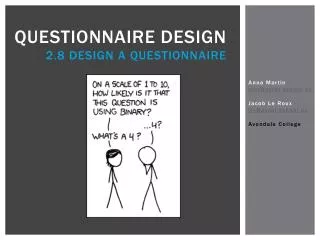
Common perceptions? Students (and some teachers) Taken from: A guide to good survey design (Statistics NZ, 2005) Students Teachers maybe Taken from: A guide to good survey design (Statistics NZ, 2005)
“MY QUESTIONNAIRE ABOUT BULLYING” • WHOS BEING BULLIED? • HAVE YOU BEEN BULLIED BEFORE? • YES • NO • HAVE ANY OF YOUR MATES BEEN BULIED? • YES • NO • IF YES PLEASE EXPLAIN HOW YOU OR YOUR MATES FELT WHEN YOU GOT BULLIED GIVE A SCALE FROM 1-10? • 1 2 3 4 5 6 7 8 9 10 • WHAT THE DIFFERENT TYPE OF BULLYING THERE IS? • HOW MANY DIFFTRENT TYPES OF BULLING YOU KNOW? • WAT IS THE MOST COMMAN TYPE OF BULLING DO YOU SEE AROUND THE ENVIOURMENT YOU LIVE IN? • WHAT DO YOU THINK IS THE MOST HARMFUL TYPE OF BULLING THERE IS AND WHY? • HOW ARE YOU PREVENTING YOU AND OTHER PEOPLE AROUND YOU FROM GETTING BULIED? • ARE YOU TRYTING TO STOP BULLYING FROM HAPPENING? • HOW ARE YOU TRYING TO STOP BULLYING FROM HAPPENING? • WOULD IT MAKE IT EASIER TO STOP BULLYING IF YOUR MATES AND THE PEOPLE AROUND YOU HELPD? • IS ANYONE DOING ANYTHING TO STOP THIS ACT OF STUPIDITY? • IS THEIR ANYONE YOU KNOW THAT ARE TRYING TO STOP BULLING?AND WHO? • WHAT ARE THEY DOING TO TRY AND STOP BULLYING? • ARE YOU HELPING THEM?AND HOW?
Feedback from other students in the class • Questions are not specific enough • Make sure questions are understandable • Slang is not appropriate • Maybe use more questions like numerical, scale and mutli-choice questions • Maybe get some general information as well • Too fuzzy to read • Question doesn’t make sense • Need more space for answers • Too many open ended questions • What’s the rating scale? What’s highest, what’s lowest? • Most of the questions were the same and they did not make sense
Information on questionnaire design principles • Some information in “old” Level 2 US books • http://www.stats.govt.nz/surveys_and_methods.aspx • Google searches ……. • These sources can give you great examples of good/bad questions, good processes to follow when designing a questionnaire, maybe even ideas for questionnaires for students to develop BUT how do you teach the process of questionnaire design to students?
Key ideas for teaching questionnaire design (what we’ve learned!) • Students need to see the place of a questionnaire in a statistical enquiry • Students need to develop a clear purpose/reason for their survey • Students need to think about what data the questionnaire will generate • Students should focus on writing good questions • Teachers should focus on asking good questions
Examples of learning activities Questionnaires and PPDAC Developing a purpose Writing questions Thinking about data/analysis Reviewing a questionnaire Practising the process
Questionnaires and PPDAC • Give students a copy of the census at school Q • Get them to complete the questionnaire • Ask them to identify the different types of questions used and develop names for the types of questions • Ask them to identify positive features of the questionnaire and why they are used • Access data from census at schooland do some simple analysis to make statements
Developing a purpose • Develop a questionnaire for the school’s canteen…… • Who wants the questionnaire written? • What is the purpose of the survey? • Who will complete the questionnaire? • What information do they need? • The canteen is a business, so they want happy customers who spend lots of money.
Developing a purpose • What is the favourite food item? How much money are you willing to spend each week at the tuck shop? What would you like to see an improvement of in the food menu? Do you find the food affordable? Do you think the food we are selling is good quality? Are the staff friendly towards you? How long are you willing to wait in the busy tuckshop? What can we do to improve this tuck shop in any way? Is the food worth the price? How often do you spend money at the tuck shop? What do you think about the hygiene of the tuck shop? Does the way the tuck shop look make you want to buy there or put you off? Do you have to wait too long for your food? • Group these questions into three/four key areas
Explain more about the purpose Write a couple of sentences about the purpose for the survey Write down ideas about the kinds of questions you could ask Brainstorm the data you could collect related to the purpose you have chosen Group your ideas into three or four key areas to investigate and write down what these are
Summarise the purpose Write down what is the general thing you want to find out Write down what specific areas you will focus on Write down who are the users for the questionnaire Write down what information/data you will collect and why this will be important to person who wants the questionnaire written – what “facts” will you be able to present to them and why will they care
Writing questions • After a brainstorm of questions that could be asked, and a grouping of key areas, get students to try writing one of each type of each question for each of the key areas for the questionnaire then ask them…. • Is each question needed? Why would it be important to the tuck shop? • Why would you want a mix of types of questions in the questionnaire? • What do you need to be careful about when writing your questions? • What kind of analysis/information could you produce with the answers from your questions? • How will you order your questions in the questionnaire? How will you present your questionnaire? • Are there questions that can be linked to each other?
Who does the tuck shop want to find out information about? LO: Consider the target population when designing a questionnaire This is the target population.
Who will they give the questionnaire to? LO: Consider the target population when designing a questionnaire This is called the sample.
How will they know who has completed their questionnaire? LO: Consider the target population when designing a questionnaire Include a general information section at the beginning of the questionnaire.
What questions should they ask in the general information section? LO: Consider the target population when designing a questionnaire They should link to the information they need to make changes.
Include a general information section Organise your questionnaire by sections Include a range of question types Consider the order of your questions FIRST DRAFT Design a one page questionnaire for the school tuck shop. SAVE YOUR WORK!
Thinking about data/analysis • Students should see a questionnaire as a tool for gathering data • It might be for a specific investigation, or provide data that can be investigate (like census at school) • They should link the types of questions they use to the type of data they will generate to the analysis/conclusions they will be able to make
For each question and answers given, identify the type of question, the type of graph that could be drawn and what statistics could be calculated. Do the analysis and then make a statement that summarises the answers using the displays and measures. LO: Describe analysis that could be used to interpret the results of a question
Question One What year level are you? 9 10 11 12 13 LO: Describe analysis that could be used to interpret the results of a question Identify the type of question Identify which graph could be drawn What statistics could be calculated Produce displays and measures Write a statement that summarisesthe answers using the displays and measures Answers: 9 12 people 10 18 people 11 35 people 12 8 people 13 27 people
Question Two How long do you spend doing homework each night (to the nearest 5 minutes?) LO: Describe analysis that could be used to interpret the results of a question Identify the type of question Identify which graph could be drawn What statistics could be calculated Produce displays and measures Write a statement that summarisesthe answers using the displays and measures Answers: 5, 20, 15, 35, 90, 20, 25, 30, 15, 0, 0, 20, 35, 30, 40, 120, 55, 45, 25
Reviewing a questionnaire • Not just about good or bad questions (although this is important) • Focus on whether it is “fit for purpose” – hard to do if the purpose is not clear! • Identify positive features as well as areas for improvement
For each question give, identify which type of question it is, identify any issues with the question, and explain how you might improve the question and why. LO: Identify issues with questions and discuss improvements
Question One LO: Identify issues with questions and discuss improvements Identify which type of question it is Identify any issues with the question Explain how you might improve the question and why. ‘Is there normally an adult at home during the day?’
LO: Identify issues with questions and discuss improvements Question Two ‘How much money would you be prepared to spend on a burglar alarm?’ $500 $1000 $1500 Identify which type of question it is Identify any issues with the question Explain how you might improve the question and why.
LO: Identify issues with questions and discuss improvements Question Three ‘How much television did you watch last year?’ Identify which type of question it is Identify any issues with the question Explain how you might improve the question and why.
LO: Identify issues with questions and discuss improvements Question Four ‘Do you agree that trains and buses and taxis are kept clean enough?’ Identify which type of question it is Identify any issues with the question Explain how you might improve the question and why.
LO: Identify issues with questions and discuss improvements Question Five Do you think teachers are: very kind fairly kind not very kind? Identify which type of question it is Identify any issues with the question Explain how you might improve the question and why.
Desk review Reflect on, analyse and refine your questions Check your questions for clarity. Make notes about why you think the questions will work well or what you need to change about them and why Consider the questionnaire as a whole and make notes about how many questions you have, the order of them, how they link to each other, and whether you need to remove or re-order any of them and why Evaluate how well your questionnaire meets the purpose Consider the analysis that could be used for the data generated from the questions Think about the overall purpose for your questionnaire and what data you want to get out of it
Pilot survey Give copies of your questionnaire to others in the class and get them to fill them out. Ask them to also write feedback about your questionnaire e.g. areas that need improvement and why Check their responses and then write about what you found out about the design of your questionnaire: Did some questions work better than others? Why? Are there any you need to change? Why? Use one of the copies of your questionnaire to write notes and make changes to questions. Think about the overall purpose for your questionnaire and what data you want to get out of it
Journal notes • How many people did you test your questionnaire on? Did they have any difficulty completing it? Why or why not? • What data did your questionnaire produce (give examples)? Is this what you expected? • Do you need to make changes to your questionnaire? What (be specific)? Why? • When you have made your notes, then create the final draft of your questionnaire and re-submit. Think about the overall purpose for your questionnaire and what data you want to get out of it
Practising the process Give students a really good context to investigate – one that they will want to find out more about • Take the opportunity to help improve your students literacy skills by giving them background information to read and identify key points • Get them to reflect on each stage of their design process – they can go back and change things at any stage of the process • Provide focus questions for each stage of the design process (this can be in the form of a checklist) - make them thinking questions rather than procedural questions • Get other students in the class to review and give feedback on their questionnaire – this helps them learn as well demonstrates to youif they understand questionnaire design • Use Moodle or tools like survey monkey to try their questionnaires out on a larger audience
Practising the process Give students a really good context to investigate – one that they will want to find out more about • Take the opportunity to help improve your students literacy skills by giving them background information to read and identify key points • Get them to reflect on each stage of their design process – they can go back and change things at any stage of the process • Provide focus questions for each stage of the design process (this can be in the form of a checklist) - make them thinking questions rather than procedural questions • Get other students in the class to review and give feedback on their questionnaire – this helps them learn as well demonstrates to youif they understand questionnaire design • Use Moodle or tools like survey monkey to try their questionnaires out on a larger audience
THE CONTEXT Scientists fear that more and more teenagers are becoming addicted to technology.
Planning the questionnaire On the next few slides you will be shown information from an article. Write down 3 key points from each page.
NEWSPAPER ARTICLE Have you ever interrupted childbirth, a wedding, funeral or graduation ceremony to send a text? Does the thought of going cold turkey from technology make you want to daub your social networking status in your own blood across the nearest brick wall? Is your ideal six-month sabbatical from work an extended period playing World of Warcraft in a windowless bedroom? It talks about how sometimes we text during important stuff and how get interrupted or distracted. It also talks about how we can’t go without technology and how proud we would be if the time we play video games got extended.
NEWSPAPER ARTICLE People are contracting the computer bug early: according to research published last September by Cranfield University School of Management in Northampton, of 260 secondary school pupils surveyed, 26 per cent spent more than six hours a day on the internet. This bevy of high-tech tykes yielded 63 per cent who felt they were addicted to the web, 53 per cent who had a compulsive attachment to their mobile phones and 62 per cent who were bought their first computer before the age of 8. But is technophilia really such a plague? It talks about how people are contracting the computer bug early. It also talks about how much we spend on the internet and how technology is taking over the world.
NEWSPAPER ARTICLE "If teenagers become more withdrawn they run the risk of being developmentally out of step with their peers," says Capio Nightingale's consultant psychiatrist Dr Richard Graham. "It's a very young field of research, but there is some evidence to suggest that girls who spend too much time on Facebook miss out on key developmental steps and could feel immature. Extreme cases can put people's education and employment at risk. This article talks about how teenagers get sucked into technology and how they can sometimes split us from our parents. It also talks about how technology can have a big impact on our future.
NEWSPAPER ARTICLE Then there are the physical aspects. You can have a poor diet, lose weight, not eat properly. If teenagers are pulling all-nighters they might turn to stimulants, like caffeine or taurine, and there is evidence that can increase anxiety in the long-term." Teenagers, necessarily, are a high-risk group, as are those who've had a bereavement, separation or redundancy. But no one is free from its impact. This talks about how technology is bad and how it can get us into drugs and that. It also tells us how we can get so addicted it can stop us from eating.
NEWSPAPER ARTICLE "At the moment people are trying to study the effects of high exposure to technology during the early parts of people's lives," continues Graham. "There are developmental windows in which 'wiring' of the brain takes place. For example, if you have a squint and it is not dealt with in the first five years of your life, part of your visual cortex switches off. It's a 'use it or lose it' principle in neurology and it might have relevance here." This article talks about how technology wrecks our studies and it effects our learning and how it affects our brain.
Final draft questionnaire • Produce the final version of your questionnaire. • Makes notes in your journal about: • Three good things about your overall questionnaire • Three things you were thinking of when you designed your questionnaire • How well will your questionnaire will be effective in generating data • How will your questionnaire meet your purpose Think about the overall purpose for your questionnaire and what data you want to get out of it