Download
1 / 24
240 likes | 361 Views
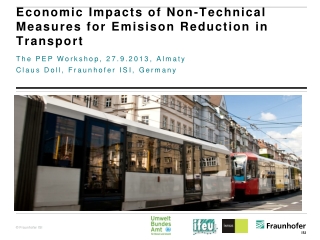
Economic Impacts of Non-Technical Measures for Emisison Reduction in Transport. The PEP Workshop, 27.9.2013, Almaty Claus Doll, Fraunhofer ISI, Germany. Clean air in cities through clean cars. More efficient motors and new propulsion technology

E N D
Economic Impacts of Non-Technical MeasuresforEmisisonReduction in Transport The PEP Workshop, 27.9.2013, Almaty Claus Doll, Fraunhofer ISI, Germany
Clean air in cities through clean cars • More efficient motors and new propulsion technology • 90% reduction of most pollutants in road transport since 1990 • 50% reduction in road fatalities
Background: Past and Future of Road Transport‘s Environmental Effects ... but more cars lead to • Congestion and a huge waste of time • Rising CO2 emissions together with increasing damage per ton of CO2 • More accidents, particularly with vulnerable road users • More noise pollution with serious health implications Valuation of CO2 emissions
Total external costs of transport in Europe 2008: 515 bn. € or 1000 € per inhabitant
Decades of fostering car free travel in European cities - no measurable effect Data source: Eurostat Urban Audit Database
The Study „Economic Aspects of Non-Technical Measures for Emission Reduction in Transport“ Core research questions: • Does low emission and sustainable mobility pay off for the user? • Which consequences do sustainable mobility patterns have for society? • By which instruments can we achieve the ecological reconstruction of curent mobility systems? Client: German Federal Environment Agency (UBA) Projektteam: Fraunhofer ISI, Karlsruhe (lead) INFRAS, Zürich IFEU, Heidelberg Laufzeit: Nov. 2009 – Oct. 2012 Internet: www.ntm.isi-projekt.de
The case studies: five measures for reducing emissions in transport Measure1: 10 %-points more cyclingand walkingin clities Measure 2: 10 %-points more bus and tram in cities Measure 3: 10 % shorter journeys onall relations Measure 4: 10 % less fuel use per person on all car trips Measure 5: 10 %-points more rail in long-distance freight Individual level: What do these measures mean for the user? Macro-economic level: Which impacts does the implementation of the measures have on the economy? Policy level: Which instruments are suitable to implement the measures?
The PExMo mobility cost calculator Features: • Tool in MS Excel • Multi-modal trip chains • Cars by size and emission class • Single and season tickets for PT, rail and Carsharing • Time costs by trip purpose, mode and level of congestion. • External costs of climate change, air pollution and noise by mode, urban/rural environment and time of day Frei verfügbar unter: www.ntm.isi-projekt.de/downloads.php
Personal benefits of more cycling and walking Example: Commuting (15 km, 250 days/a); cycling instead of driving a car. Direct and indirect annual savings: • Car owning and use: +3100 € • Health benefits +1900 € • Environment, noise + 150 € • Travel and wait time -1700 € • Safety -1900 € • Total +1500 € Comparing commute and leisure trips in cities with car (compact), PT, bike and walking Annual costs (euros) Car Bike Walk Short leisure trips 3 km Car Bike Commuting 15 km Environment * Safety Lost health benefits Travel & wait time Direct private costs * Including climate and noise Source: PExMO-Tool (Fraunhofer) • Impacts: • Car size, exhaust standard, number of passengers • Length and type of route, state of fitness of the traveller
Personal benefits through more public transport use Example: Commuting (15 km, 250 days/year) by bus/tram instead of car. Direct and indirect savings per year • Car and tickets:^^ +2300 € • Health impacts + 600 € • Safety: + 200 € • Environment, noise + 100 € • Travel and wait time - 300 € • Total +2900 € Annual costs (euros) Car Tram leisure trips 3 km Car Tram Bike & Tram Commuting 15 km Environment * Safety Lost health benefits Travel & wait time Direct private costs * Including climate and noise Source: PExMO-Tool (Fraunhofer) • Impacts: • Size, age, emission standard and occupancy of the car, • Distance from / to public transport stops, number of interchanges, occupancy rate and environmental friendliness of bus and tram fleet.
Personal benefit of more efficient car use Example: Commute (15 km, 250 days/a) by car with 2 instead of 1 person. Direct and indirect savings per year: • Car owning and use +1800 € • Safety + 200 € • External impacts + 100 € • Health impacts 0 € • Travel and wait time 0 € • Total + 2100 € Comparing commute, leisure and business trips in cities with car of different size and occupancy Annual costs (euros) Mid class Small Mid class petrol E3 petrol E5 petrol E3 1 person 1 person 2 persons Commuting 15 km Upper cl. Compact Upper cl. diesel E3 diesel E5 diesel E3 1 person 1 person 2 persons Business trip 100 km Environment * Safety Travel & wait time Direct private costs * Including climate and noise Source: PExMO-Tool (Fraunhofer) • Einflussgrößen: • Pkw-Größe, Umweltstandard und Anzahl der Insassen • Zeitaufwand zur Erhöhung des Besetzungsgrades
Macro-economic modelling approach with ASTRA System dynamics model ASTRA-D: • Developed since 1998 for EC and German institutions • Closed macro-economic feedback model • Integrated consideration of transport and economic sectors • Time sequence of policy measures possible • Modeling of second round effects • Detailed computation of emissions by mode and time
Macto-economic benefits of more active mobility • More cycling helps public transport. Doing so we provide a real alternative to the private car. • The environmental alliance creates investments and jobs (+4%), which more than balance less production in the automotive industry. • Travel time increases also in remaining car travel due to de-acceleration measures. Well received in times of increasing stress and burn out. • Emissions: air pollutants (-8%) decline more intensively than CO2-Emissionsn (-2%) due to energy use of public transport. Instruments: • Parking fees, congestion charges • Investment in cycle lanes • Advertisement and campaigns Macro-economic key indicators Macro-economic key indicators Gross domestic product Employment transport Emplayment general Infrastructure transport Infrastructure general Travel time CO2 emissions Pollutions (NOx) Particles (PM) Change to scenario without measures (%)
Selected macro-economicindicators: measurescomparedtobasecase M1: cycle & walk M2: public transport M3: shorter paths M4: fuel efficiency M5: rail freight
Comparison of macro-economic costs and benefits – without travel time Curr. value 2010(bill. Euro) * Ohne Zeitkosten
Comparison of macro-economic costs and benefits – with travel time * Net presentvaluewith 2020 and 2030 values
Success factors to shift people away from the private car Most important: classical hard facors of public transport supply: • Network density • Costs • Travel speeds Soft factors relevant, but less expressed: • Safety (accidents + crime) • Staff (friendliness) Source: USEmobility project EC 7th Framework Programme)
Linked success of public transport, walking and cycling policies Survey on UIPT Urban Mobility Database: Main success factors for public transport use: • Quality of supply (vehicle kilometres) • Generalised costs in relation to cars • Number of bike parking places • Percentage of green areas in cities Success of walking & cycling closely linked to PT With good and complete alternatives people are ready to go without car
Recommendations The case studies show, that transforming mobility systems to a more sustainable one is possible and pays off for the individual and the society • In addition to environment and climate protection transport users users save money.In addition they experience a considerable health benefit when cycling or walking more of up to 2000 €/year. • For shifting travel demand away from the private car, investments in cycling and walking infrastructure and in PTare required. This mostly balances out income declines in the automotive industry. • Transport systems may be successfully transformed by setting prices and fees, various regulatory measures, attractive and high capacity PT services as well as a modern region and city concepts (city of short paths). Most powerful are combinations of push and pull measures.
Positive Vision 2050: Seamless and sustainable mobility New personal transporters (PT) Reservation Using Information Billing Car-sharing PTAs Mobility Card PT / Bike-sharing Modern public transport Electric city cars
Implications for central Asia • Due to income levels, benefits and costs of policies for walking and cycling are considerably lower. But benefit to cost ratios may be similar • Mentality differences may exist. But successful examples from Europe indicate, that environmentally friendly travel can be implemented in very different cities. • New technoligies (e-bikes) and organisational forms (carsharing) may help that central asian countries manage mobility in quickly developing economies better than the west in the past 50 years
Availablematerials Atwww.ntm.isi-projekt.destudyreports and the PExMo toolareavailable (German only): • E-Paper forpubliccommunication (German) • Fullreport (German)Summary (German and English) • PExMo CostCalculator (German) • 5 measureleaflets: (German)