Download
1 / 1
10 likes | 72 Views
A detailed study using CFD modeling to optimize the thermal efficiency of Princeton's data center, reducing energy costs and emissions. Includes a step-by-step methodology and results.

E N D
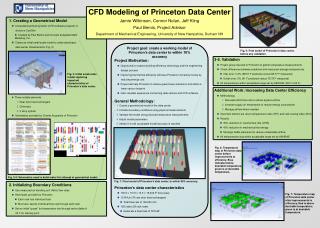
CFD Modeling of Princeton Data Center Jamie Wilkinson, Connor Nolan, Jeff Kling Paul Bemis, Project Advisor Department of Mechanical Engineering, University of New Hampshire, Durham NH 1. Creating a Geometrical Model • Computational fluid dynamic (CFD) software program of choice is CoolSim • Created by Paul Bemis and his team at Applied Math Modeling, Inc. • Create an initial small scale model to understand basic data center characteristics (Fig. 2) • Three notable elements 1. Rear door heat exchangers 2. Chimneys 3. 3 story system • Schematics provided by Charles Augustine of Princeton Project goal: create a working model of Princeton’s data center to within 10% accuracy Fig. 5: First model of Princeton’s data center, before any validation. Project Motivation: • Opportunity to explore building efficiency technology and the engineering design process • Improving the thermal efficiency will save Princeton University money by reducing energy cost • Project will help Princeton to reduce greenhouse emissions and obtain a lower carbon footprint • Gain valuable experience concerning data centers and CFD software. 3-5. Validation • Project group traveled to Princeton to gather temperature measurements • Check differences between predicted and measured average temperatures • Inlet error: 0.3% (68.57 F predicted versus 68.77 F measured) • Outlet error: 5% (81 F predicted versus 76.75 F measured) • All temperatures within acceptable range set by ASHRAE (59 F to 90 F) Fig. 2: Initial small-scale model capturing important characteristics of Princeton’s data center. Additional Work: Increasing Data Center Efficiency • Methodology 1. Decrease AHU flow rate to reduce bypass airflow 2. Increase supply air temperature to reduce energy consumption 3. Manage airflow where needed • Important metrics are return temperature index (RTI) and rack cooling index (RCI) • Results • 30% reduction in volume flow rate (CFM) • 43% reduction in mechanical fan energy • Strategic baffle placement to reduce undesirable airflow • All temperatures stay within acceptable range set by ASHRAE General Methodology: 1.Create a geometrical model of the data center 2.Initialize boundary conditions using physical measurements 3.Validate the model using physical temperature measurements 4.Adjust model parameters 5.Iterate 3-4 until acceptable model accuracy is reached Fig. 6: Temperature map of Princeton data center before improvements to efficiency. Blue indicates below desirable temperature; green is at desirable temperature. Fig. 3/4: Schematics used to build make first attempt at geometrical model. Fig. 1: Final model of Princeton’s data center, to within 95% accuracy. Princeton’s data center characteristics • 136 ft x 110 ft x 10 ft (~15,000 ft2 floor area) • 12 AHUs (75 rear-door heat exchangers) • Total flow rate of 166,000 cfm • 192 racks (29 rack rows) • Generate a heat load of 757 kW 2. Initializing Boundary Conditions • Use measured air handling unit (AHU) flow rates • Heat loads provided by Princeton • Each rack has individual load • Must also specify individual flow rate through each rack • Set an initial “guess” for temperature rise through racks (delta of 20 F for starting point Fig. 7: Temperature map of Princeton data center after improvements to efficiency. Red is above desirable temperature; green is at desirable temperature.