Download
1 / 56
560 likes | 729 Views
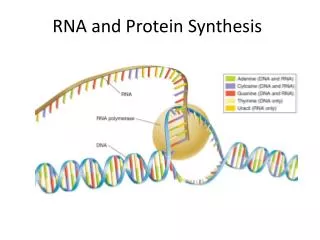
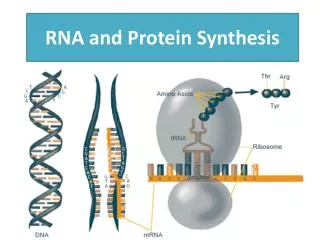
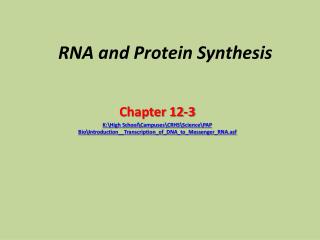
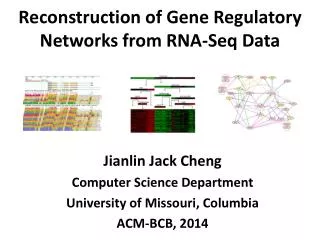
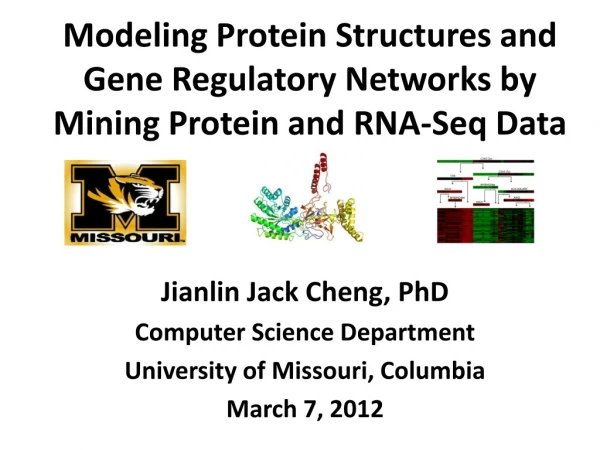
Modeling Protein Structures and Gene Regulatory Networks by Mining Protein and RNA-Seq Data. Jianlin Jack Cheng, PhD Computer Science Department University of Missouri, Columbia March 7, 2012. Two Challenges. Protein Structure Modeling Gene Regulatory Network Modeling. The Genomic Era.

E N D
Modeling Protein Structures and Gene Regulatory Networks by Mining Protein and RNA-Seq Data Jianlin Jack Cheng, PhD Computer Science Department University of Missouri, Columbia March 7, 2012
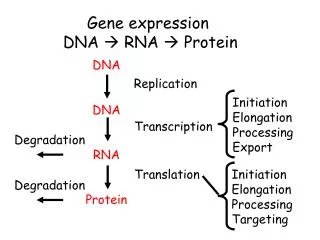
Two Challenges • Protein Structure Modeling • Gene Regulatory Network Modeling
The Genomic Era Collins, Venter, Human Genome, 2000
Sequencing Revolution • $1000 Personal Genome in 2010s • Transcriptome • Proteome
Genome Implications to Information Sciences and Life Sciences Elements and Systems
Growth of Protein Sequences AGCWY…
Computational Protein Structure Folding / Prediction Structure = f ( sequence) ? E = MC2
Template-Based Approach Chothia, Nature,1992 Protein sequence space is astronomical! Protein structure space is limited! Protein Data Bank Fold MWLKKFGINKH… Recognition Alignment Target protein Template
Modeller Fisher, 2005
Template-Free Protein Structure Prediction http://pubs.acs.org/subscribe/archive/mdd/v03/i09/html/willis.html
Template-Free Approach Sampling: MCMC and Simulated Annealing MWLKKFGINLLIGQSV… Simulation …… Select structure with minimum free energy
Major Challenges in Protein Structure Prediction • Select best templates? • Generate best alignments? • Generate best models? • Select best models? Pick a needle in a stack of hay!
Major Challenges in Protein Structure Prediction • Select best templates? • Generate best alignments? • Generate best models? • Select best models? Wang, Eickholt, Cheng, Bioinformatics, 2010
A Conformation Ensemble Approach • P(conformation) P(-energy) • Conformation Distribution • Maximum Likelihood & Maximum a Posterior Brooks et al., 2001
New Views on Protein Modeling Protein structure modeling problem is simply a grand computational and statistical sampling problem. • Random sampling (template-free) • Targeted sampling (template-based)
A Unified Protein Structure Prediction Pipeline 1. Template Ranking 2. Multiple-Template Combination Combination Alignments MAR-TCRK-EGAP-WY… Y-R-MH-R-DGM-MWT… TAKMTHK-DEGFG-YW… Query-Template 1 Input Query MARTCRKEGAP-WY… Y-RMH-RDGM-MWT… MARTCRKE… . . . Query-Template 2 MAR-TCRK-EGAPWY… TAKMTHK-DEGFGYW… . . . . . . 4. Evaluation & Refinement 3. Model Generation Output Wang et al., Bioinformatics, 2010
Sampling in Alignment and Fold Space • PSI-BLAST (sequence – profile) • SAM (sequence – HMM) • HMMer (sequence – HMM) • Compass (profile – profile) • HHSearch (HMM - HMM) • PRC (HMM-HMM) • FOLDpro (machine learning) • MSACompro (profile-profile) Cheng, Baldi, Bioinformatics, 2006 Deng, Cheng, BMC Bioinformatics, 2011
Multi-Template Combination in Template and Alignment Space Query VR-RNNMGMPLIESSSYHDALFTLGYAGDRISQMLGMRYANNLHDLFLAEGYYEASQRKR Temp1 IAHIYANNLHDLFLAEGYYEASQRLFEIEL FGLMGN LSSWVGA (10-80) Temp2 LLAQ-GRLSEMAGADALDVNIYIDSNG (10-70) Temp3 QGTARDRAWQLEVERHRAQGTSASFL (10-10) Temp4 AANQLDAMRALGYAQERYFEMDLMRRAPAGELSELFGAKAVDLK (10-5) Cheng, BMC Structure Biology, 2008
Multi-Template Combination in Template and Alignment Space Query VR-RNNMGMPLIESSSYHDALFTLGYAGDRISQMLGMRYANNLHDLFLAEGYYEASQRKR Temp1 IAHIYANNLHDLFLAEGYYEASQRLFEIEL------FGLMGN------LSSWVGA----- (10-80) Temp2 LLAQ-GRLSEMAGADALDVNIYIDSNG--------------------------------- (10-70) Temp3 ---------------------------ARDRAWQLEVERHRAQGTSASFL---------- (10-10) Temp4 ----------------------------------------------------GAKAVDLK (10-5)
Cheng, BMC Structure Biology, 2008 Advantage: reduce variance of modeling
Multi-Template VS Single-Top-Template Improve 38 / 45 targets Improvement by 6.8% P-value < 10-4 Cheng, BMC Structure Biology, 2008
Combination of Template-Free and Template-Based Sampling 100% TBM 50% TBM+50%FM 100% FM Protein Modeling Spectrum
Recursive Protein Modeling – Integrate TBM and FM Initial Region Decomposition Model aligned / certain regions by TBM Keep certain regions / core fixed Divide & Conquer Conditional Sampling Model unaligned / uncertain regions by FM Compose TBM, FM components into larger certain components Increase fitness & reduce bias Satisfactory? No Repeat Yes Cheng et al., 2011
Recursive Modeling Mimics Protein Folding Cascade ks.uiuc.edu
Template-Based + Template-Free & Recursive Modeling (CASP9) Cheng et al., 2011
Insights – A Bayesian Approach • Incorporate prior information: template-based region • Conditional sampling: use certain regions to constrain uncertain regions • Reduce uncertainty gradually • Iteratively optimize the conformation
Model Selection • Single model approach • Ensemble approach Wang et al., Proteins, 2009 Cheng et al., Proteins, 2009 Wang et al., Bioinformatics, 2011
Model Quality Evaluation Select top 5 ranked models as references . . .
Model Quality Assessment Top Five A V E R A G E Compare each model with reference models Average global quality Re-rank models (+10%) . . . Cheng et al., Proteins, 2009 Wang and Cheng, 2011
Iterative Ranking Wang and Cheng, 2011 Randomly selecting five reference models seems to work
Model Refinement by Model Combination Structure comparison . . . Select top 5 models as seed models . . . Identify similar models or fragments Model ranking
Model Combination and Averaging Average Advantage: reduce variance of modeling – maximize likelihood
CASP9 Top 20 Servers http://predictioncenter.org/casp9/
CASP9 Top 20 Servers on AB Initio Targets http://predictioncenter.org/casp9/
Some High-Quality CASP Predictions T0390 GDT=0.90 T0426 GDT=0.97 T0432 GDT=0.92 T0458 GDT=0.97 Orange: structure; Green: model 50 of 120 CASP8 targets are in high-accuracy, RMSD < 2 Å Wang et al, 2010
Modeling Gene Regulation Process by Mining RNA-Seq Data • Tens of thousands of genes • Expression of gene is regulated • Genes tend to function in groups • Regulators and targets Hasty et al., 2001
Gene Regulatory Network Modeling (RNA-Seq, Microarray) Zhu et al., in preparation
RNA-Seq Data Processing Steps • Isolate RNA • Prepare a RNA library • RNA sequencing by NGS • Reads mapping • Quantification and analysis Pepke et al., 2009
RNA-Seq Data Mapping • Un-mapped reads • Ambiguous reads • Biological variance versus technology variance • Tool: TopHat, Bowie Hass & Zody, 2010
Construct Gene Expression Profiles • Count the number of reads mapped to each gene • Normalize counts into quantitative values by length of genes and total number of reads • Tools: Cufflink, HTseq, MULTICOM • RPKM - reads per kb per million reads
Mapping Results of Mouse Transcriptome Perturbed by Drug-like Compounds Li et al., 2011
Identify Differentially Expressed Genes • T-test (BioConductor) • Poisson distribution (edgeR) • Negative binomial distribution (DEGseq)
Differential Expression Analysis Li et al., 2011
Scatter Plot of Expression Values Li et al., 2011
Gene Regulatory Network • A cluster of genes having similar expression profiles • Several regulators whose expression can explain the expression of the cluster of genes Segal et al., Nature Genetics, 2003
Expectation Maximization Approach Generate initial clusters using K-means Recursively select TFs to construct decision tree to maximize likelihood Reassign gene to a tree that maximize its likelihood Likelihood increased? Yes No