Figure_e-1
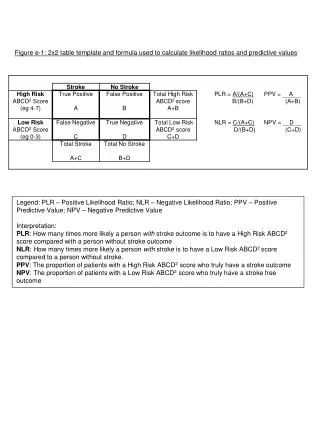
Figure e-1: 2x2 table template and formula used to calculate likelihood ratios and predictive values. Legend: PLR – Positive Likelihood Ratio; NLR – Negative Likelihood Ratio; PPV – Positive Predictive Value; NPV – Negative Predictive Value Interpretation:

Figure_e-1
E N D
Presentation Transcript
Figure e-1: 2x2 table template and formula used to calculate likelihood ratios and predictive values Legend: PLR – Positive Likelihood Ratio; NLR – Negative Likelihood Ratio; PPV – Positive Predictive Value; NPV – Negative Predictive Value Interpretation: PLR: How many times more likely a person with stroke outcome is to have a High Risk ABCD2 score compared with a person without stroke outcome NLR: How many times more likely a person with stroke is to have a Low Risk ABCD2 score compared to a person without stroke. PPV: The proportion of patients with a High Risk ABCD2 score who truly have a stroke outcome NPV: The proportion of patients with a Low Risk ABCD2 score who truly have a stroke free outcome