Download
1 / 19
190 likes | 279 Views
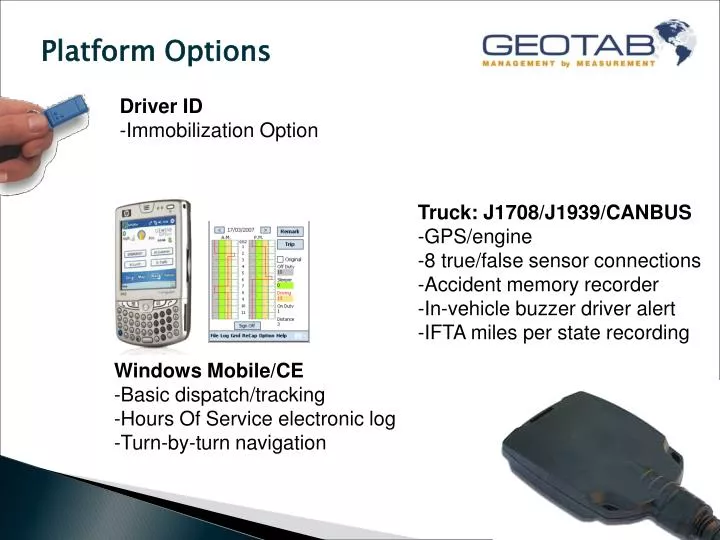
Platform Options. Driver ID Immobilization Option. Truck: J1708/J1939/CANBUS GPS/engine 8 true/false sensor connections Accident memory recorder In-vehicle buzzer driver alert IFTA miles per state recording. Windows Mobile/CE Basic dispatch/tracking Hours Of Service electronic log

E N D
Platform Options • Driver ID • Immobilization Option • Truck: J1708/J1939/CANBUS • GPS/engine • 8 true/false sensor connections • Accident memory recorder • In-vehicle buzzer driver alert • IFTA miles per state recording • Windows Mobile/CE • Basic dispatch/tracking • Hours Of Service electronic log • Turn-by-turn navigation
Geotab Complete Kit GPS, Engine Diagnostics (auto to truck: OBDII, J1708. J1939) Mileage per State 8 sensor inputs, Driver buzzer alert Accelerometer Accident Wraparound Memory Hourly Voltage, Daily Location Heartbeat Wireless Options (GSM, CDMA, 900Mhz, Wi-Fi) Serial Connection to Third Party Devices Driver ID/Immobilization Fully Software Supported Over The Air Updates Gateway Software Development Kit
Enterprise Software Multi-Group, Flexible User Hierarchy, Hierarchy Access/Roll-up Reporting Secure User Authentication - Limit Access to features based on User Profile Communication Exceptions – TXT, Email, Windows Work Hours – Setup unique shifts/Work Hours for after hours reporting
Miles Driven This example of 10 vehicles in pilot (2 in Orlando, 3 in Sarasota and 5 in Tampa). The average for the combined 10 vehicles is 4,754 miles/week. While Sarasota has 2 fewer vehicles in the field trial, the large territory means vehicles driver farther to serve customers. This chart more accurately reflects the per vehicle mileage - total of all vehicles for the branch/the number of vehicles This chart is a useful tool when asset balancing or customer balancing - (moving vehicles between branches or acquiring new vehicles – or moving customer responsibility from one site to another). 452 miles 654 miles 377 miles
Mileage based KPIs Results will enable development of KPIs to optimize asset use, customer management and time management. Review mile/customer time KPIs such as: Average Miles per vehicle per customer visit Average Miles driven from home to first customer call/last customer call
Fuel Tax Mileage Data Geotab captures distance driven per vehicle per state very accurately. The Fuel Tax Report takes advantage of Geotab’s unique method of trip recording and combines it with advanced zones surrounding each state to provide a report for mileage built for each state in the USA and province in Canada,
Hours of Service Driver uses touch screen to indicate status. Log available on screen for inspection. Data is sent to a central server that generates reports for signature and filing. Geotab device provide authentication/back up of activity under audit.
Time Measurement Daily trips are recorded After hours trips (morning departures/night arrivals) are highlighted in yellow “Zoned” stops are in green If unzoned –the address is shown – these stops will be reviewed to see if they are customer stops Stop Time, miles, excessive idling are detailed.
Time Measurement Tampa data is skewed for the week – 1 vehicle not driven all week (parked at employee home)
GPS and in-vehicle speed alert Human Resources Actively Reinforcing Policy Risk & Safety CLAIMS INCIDENTS - 4500 vehicles tracked After focusing internally in risk areas including after hours use policy, WC claims investigation, speed, and other aggressive driving behaviors, an average annual $1,277 cost is realized.
Tues Jan 20 8:10AM Gets Jumpstart Sun Jan 18 10:30PM Below 10V Next Alert Mon Jan 19 3:30PM Below 8V Will Need Jumpstart Sat Jan 17 10:30PM Below 11/5V First Alert Engine Management Geotab Battery Health Monitor After fuel, jumpstarts and electrical health (alternator and starter) represent one of the highest costs in operating a fleet and may result in lost productivity and customer satisfaction.
Customer Management Information can be combined with route plan data for actual vs planned performance.
Employee Achievement SPEED INCIDENT > 75MPH PERSONAL INJURY (Seatbelt and Speed) and Engine Idling message delivered to employees during WEEK 4 SEATBELT OFF WHILE DRIVING
Stanmex, Inc. Authorized Dealer for Geotab, Inc. Stanmex, Inc. Authorized Dealer for Geotab, Inc. GEOTAB HOLDS REGULAR WEBINARS ON HOW TO MAXIMIZE THE BENEFIT OF YOUR GEOTAB INVESTMENT CONTACT SUPPORT AT rick@stanmex.com to join our next webinar or organize a specific training meeting
Authorized Dealer for Geotab, Inc. Mailing Address: 14320 Interdrive E. Houston, TX 77332 Authorized Dealer Contact Phone: (440) 842-7168 (281) 227-1561Facsimile 1-416-352-7432 www.stanmex.com E-mail: rick@stanmex.com