Download
1 / 28
280 likes | 402 Views
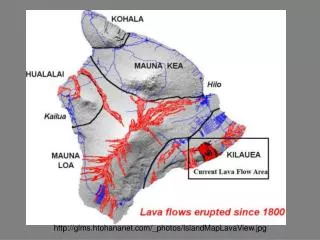
http://glms.htohananet.com/_photos/IslandMapLavaView.jpg. -. -. Pu‘u ‘O‘o scoria cone (in the early 1990s). http://z.about.com/d/gohawaii/1/0/E/H/4/kilauea2007_010.jpg. http://satftp.soest.hawaii.edu/space/hawaii/vfts/kilauea/chain_tour/air5.520x373.jpg.

E N D
- - Pu‘u ‘O‘o scoria cone (in the early 1990s)
http://satftp.soest.hawaii.edu/space/hawaii/vfts/kilauea/chain_tour/air5.520x373.jpghttp://satftp.soest.hawaii.edu/space/hawaii/vfts/kilauea/chain_tour/air5.520x373.jpg
http://www.smate.wwu.edu/teched/geology/GeoHaz/vo-HA-impact/vo-HA-impact-08.JPGhttp://www.smate.wwu.edu/teched/geology/GeoHaz/vo-HA-impact/vo-HA-impact-08.JPG
~10 m flow direction
- - - Kupaianaha lava pond and shield, with Pu‘u ‘O‘o scoria cone in the background
http://coconutgirlwireless.files.wordpress.com/2007/08/kalapana-aerial.jpghttp://coconutgirlwireless.files.wordpress.com/2007/08/kalapana-aerial.jpg
http://hvo.wr.usgs.gov/kilauea/history/1990Kalapana/19900506-JG16033_large.jpghttp://hvo.wr.usgs.gov/kilauea/history/1990Kalapana/19900506-JG16033_large.jpg
OTHER EXAMPLES OF DECREASING FLOW-FRONT ADVANCE RATES (adapted from Kilburn 1996)
the max. effusion rate was probably ~400 m3 s-1, approx. twice the effective effusion rate average effusion rate for whole eruption was ~115 m3 s-1, approx. 50% of the effective effusion rate EFFECTIVE EFFUSION RATES 1984 flows, ~2900 m vent Flow front positions from Lockwood et al. (1987) Effusion rates from Lipman et al. (1985), Lipman & Banks (1987)
http://hvo.wr.usgs.gov/kilauea/update/archive/2009/Jan/20090205_6426_L.jpghttp://hvo.wr.usgs.gov/kilauea/update/archive/2009/Jan/20090205_6426_L.jpg