Download
1 / 15
150 likes | 256 Views
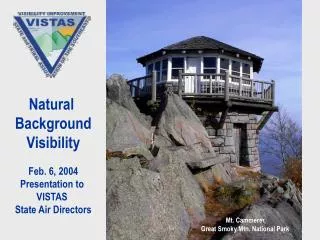
Natural Background Visibility Feb. 6, 2004 Presentation to VISTAS State Air Directors. Mt. Cammerer, Great Smoky Mtn. National Park. Natural Conditions – the IMPROVE Equation.

E N D
Natural Background Visibility Feb. 6, 2004 Presentation to VISTAS State Air Directors Mt. Cammerer, Great Smoky Mtn. National Park
Natural Conditions – the IMPROVE Equation • IMPROVE equation is used in regional haze rules for calculating reconstructed extinction from IMPROVE chemical composition data: Bext = 3 * f(RH)*([Ammonium] Sulfate + [Ammonium] Nitrate) + 4 * 1.4 x OC + 1 * SOIL Mass + 0.6 * Coarse Mass + 10 * EC + Rayleigh Scattering The EPA RHR calls for expressing visibility conditions in terms of deciviews (dv) that is defined as: dv = 10 ln (bext/10)
Natural Conditions: EPA Default Approach The default annual natural levels of PM components in EPA’s guidance (based on values that were developed for the NAPAP by Trijonis,1990) are used in the equation to calculate annual average Natural Conditions 20% worst natural conditions (dv) determined from the annual average 20% Worst (dv) = Annual Average (dv) + 1.28x 3 dv (sites in East)
Natural Background Visibility: Policy Considerations • VISTAS assumptions must be comparable to EPA and other RPOs • Retain defaults for this first SIP? • Identify alternative ranges for each Class I area in southeastern US? • How/when address non-US transported anthropogenic emissions? • Does change in assumptions for 2064 affect reasonable progress goals for 2018?
VISTAS Class 1 Area Visibility Targets Worst 20% days 35 90 Mammoth Cave 80 30 70 25 60 5 year Average Everglades 20 50 Standard Visual Range Miles 40 15 30 Deciviews Median SVR 10 20 5 10 0 0 2060 2064 2040 2020 2030 2010 2050 2018 1998-2002 1988-1992 1990-1994 1992-1996 1994-1998 1996-2000
Default vs Alternative Calculations: Does it make a difference in 2018? 20% Haziest Days 29.9 dV Natural Background (with changes) Natural Background (EPA default) 2000 2018 YEAR 2064
250 200 Coarse Soil 150 Organics EC 100 NH3NO3 (NH4)2SO4 Rayleigh 50 0 Light Extinction on 20% Haziest Days - IMPROVE 1998 - 2001 Extinction (Mm-1) Sipsey, AL Everglades, FL Dolly Sods, WV Okefenokee, GA Shenandoah, VA Cape Romain, SC Shining Rock, NC Swan Quarter, NC Linville Gorge, NC Mammoth Cave, KY Chassahowitzka, FL James Rvier Face, VA Great Smoky Mtns, TN
Natural Background Visibility: Potential Changes to Default Calculations for VISTAS Class I Areas 1Magnitude estimated as high (H), medium (M), or low (L) impact to light extinction in mm-1 on 20% haziest days
Natural Background Visibility: Potential Changes to Default Calculations for VISTAS Class I Areas 1Magnitude estimated as high (H), medium (M), or low (L) impact to light extinction in mm-1 on 20% haziest days
Natural Background Visibility: Potential Changes to Default Calculations for VISTAS Class I Areas 1Magnitude estimated as high (H), medium (M), or low (L) impact to light extinction in mm-1 on 20% haziest days
Natural Background Visibility: Potential Changes to Default Calculations for VISTAS Class I Areas 1Magnitude estimated as high (H), medium (M), or low (L) impact to light extinction in mm-1 on 20% haziest days
EPRI Recommendations for Refining Natural Background Calculation • The table on following slide shows impact of using alternative assumptions taking into account: • Background concentrations of ammonium sulfate, ammonium nitrate, OCM and EC as estimated by Dr. Daniel Jacob’s group • STI approach to calculate natural visibility for the 20% worst days • A factor of 2.0 to convert OC to OCM • A varying scattering efficiency for ammonium sulfate and ammonium nitrate using equation developed by STI
Impact of using EPRI-recommended approach on concentration reductions* needed by 2018 *Assuming uniform reductions in anthropogenically caused portion of the baseline concentrations # Sulfate and nitrate concentrations reductions alone will not be sufficient to achieve the first progress goal 15-35 percent lower concentrations reductions needed by 2018 using EPRI’s recommended approach than if use EPA’s default approach
VISTAS Recommendations: Feb 6, 2004 • Follow up with VISTAS Data Workgroup • Evaluate changes in assumptions where agreement among states and stakeholders • 92% used to represent 20% haziest days • OC multiplied by 1.8 to calculate OC mass • Others? • Define level of effort to refine estimates • seasalt, biogenic, fire, dust, transported non-US • Follow up with VISTAS Planning Workgroup • Evaluate benefits of control strategies against reasonable progress goals • Don’t change the reasonable progress goal for inter-continental transport, but estimate contribution if goal not met in 2018 • Coordinate with EPA and other RPOS
Emissions, Meteorological, Air Quality Modeling Deliverables Draft 1/16/04 Jan-Mar 2004 Define inv growth and control assumptions Jan-Jun 2004 Define BART sources Jun 2004 Identify BART controls June 2005 Economic Analyses Apr 2004 Draft “2018” National Inv Oct-Dec 2004: Control Strategy Inventories Jan 2004 Revised 2002 VISTAS Em Inv Feb 2004 Em Modeling QA + Fill Gaps Sep 2004 Revised 2002 National Inv Sep 2004 “Typical” 2002 Modeling Inv Oct 2004: Revised “2018” Em Inv Jan 2004 Met modeling protocol Feb 2004 MM5 Met runs 6 mo 2002 Sept 2004 MM5 Met Final Report Dec 2004 Revised 2002 Base Run (model performance) Dec 2004 “Typical” 2002 Run (compare to “2018” runs) Jan-Jun 2005 “2018” Control Strategy Runs Dec 04 ? “2018” Base Run Jan 2004 AQ Phase I wrapup Feb 2004 AQ modeling protocol Mar-Sep 2004 Annual 2002 CMAQ model performance Jan 2005 Phase II “2018” Sensitivity Runs July-Dec 2005: Observations Conclusions Recommendations EPA- approved Modeling Protocol May-Oct 2004 “2018” Emissions Sensitivity Runs Apr 2004: DDM in CMAQ Apr 2004 CART:select episodes Aug 2004 Natural Background and Reasonable Progress Goals State Regulatory Activities Jan 2005 Interim Future Year Model Runs Dec 2004 Interim Future Year Inventories