
Recycling Rates of Key Packaging Materials in Europe (2008)
This report analyzes the recycling rates of major packaging materials in Europe, including plastics, beverage cartons, glass, and tinplate. The data, covering various EU countries and additional regions, highlights significant differences in recycling performance, with overall rates ranging from 10% to 100%. It references authoritative sources such as APEAL and FEVE, offering insights into individual country contributions to recycling efforts. Understanding these trends is crucial for improving waste management and promoting sustainable packaging solutions across Europe.

Recycling Rates of Key Packaging Materials in Europe (2008)
E N D
Presentation Transcript
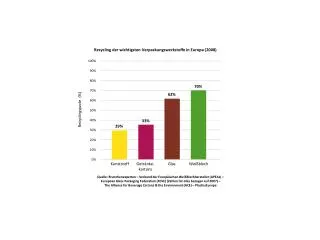
Recycling der wichtigsten Verpackungswerkstoffe in Europa (2008) 100% 90% 80% 70% 70% 62% 60% Recyclingquote (%) 50% 40% 33% 29% 30% 20% 10% 0% Kunststoff Getränke- kartons Glas Weißblech Quelle: Branchenexperten – Verband der Europäischen Weißblechhersteller (APEAL) – European Glass Packaging Federation (FEVE) (Zahlen für Glas bezogen auf 2007) – The Alliance for Beverage Cartons & the Environment (ACE) – PlasticsEurope
Weißblech-Recycling in Europa (2008) 100% 93% 89% 87% 87% 90% 83% 82% EU27 (+Norwegen & Schweiz): 70,4% 80% 77% 76% 76% 76% 80% 73% 72% 72% 71% 70% 69% 70% 68% 70% 63% 62% 57% 60% 54% 55% 48% 50% 44% Recyclinquote (%) 36% 40% 30% 21% 21% 20% 10% 0% Polen Estland Slowenien Tschech. Rep. Zypern Griechenland Rumänien Litauen Großbritannien Slowakei Frankreich Malta Italien Finnland Bulgarien Schweden Irland Dänemark Lettland Norwegen Portugal Spanien Österreich Schweiz Ungarn Niederlande Luxemburg Deutschland Belgien Belgien, Niederlande, Finnland, Lettland, Slowenien, Litauen, Estland, Malta, Bulgarien, Rumänien: Angaben beziehen sich auf Recycling von Metallverpackungen insgesamt (Weißblech und Aluminium). Finnland, Dänemark, Griechenland, Polen, Slowenien, Litauen, Rumänien: (2007 - letzte offizielle Daten) Quelle: Amtliche Angaben der Mitgliedstaaten und PROs/APEAL-Mitglieder