Download
1 / 20
200 likes | 307 Views
Organization of Course. Overall Project Issues & Examples Emissions Inventories Source-Receptor Post-Processing Source-Attribution for Deposition Model Evaluation Model Intercomparison Collaboration Possibilities. INTRODUCTION Course overview Air Toxics overview HYSPLIT overview

E N D
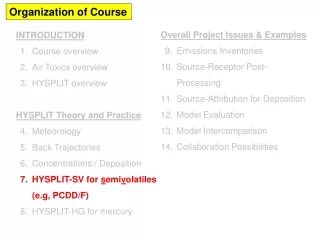
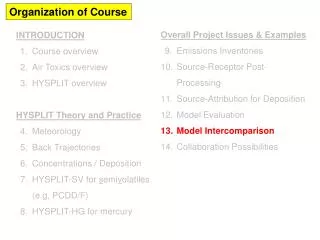
Organization of Course Overall Project Issues & Examples Emissions Inventories Source-Receptor Post-Processing Source-Attribution for Deposition Model Evaluation Model Intercomparison Collaboration Possibilities INTRODUCTION Course overview Air Toxics overview HYSPLIT overview HYSPLIT Theory and Practice Meteorology Back Trajectories Concentrations / Deposition HYSPLIT-SV for semivolatiles (e.g, PCDD/F) HYSPLIT-HG for mercury
So how good are current models, and how do they comparewith one another? 2
Calculated from data used to produce Appendix A of USEPA (2005): Clean Air Mercury Rule (CAMR) Technical Support Document: Methodology Used to Generate Deposition, Fish Tissue Methylmercury Concentrations, and Exposure for Determining Effectiveness of Utility Emissions Controls: Analysis of Mercury from Electricity Generating Units 3
HYSPLIT 1996 Different Time Periods and Locations, but Similar Results ISC: 1990-1994 4
Model-estimated U.S. utility atmospheric mercury deposition contribution to the Great Lakes: HYSPLIT-Hg (1996 meteorology, 1999 emissions) vs. CMAQ-HG (2001 meteorology, 2001 emissions). 5
Model-estimated U.S. utility atmospheric mercury deposition contribution to the Great Lakes: HYSPLIT-Hg (1996 meteorology, 1999 emissions) vs. CMAQ-Hg (2001 meteorology, 2001 emissions). • This figure also shows an added component of the CMAQ-Hg estimates -- corresponding to 25% of the CMAQ-Hg results – in an attempt to adjust the CMAQ-Hg results to account for the deposition underprediction found in the CMAQ-Hg model evaluation. 6
Summary presentedby Mark Cohen, NOAA Air Resources Laboratory, Silver Spring, MD, USA EMEP/TFMM Workshop on the Review of the MSC-E Models on HMs and POPsOct 13-14, 2005Hotel Mir, Moscow Russia EMEP Intercomparison Study of Numerical Models for Long-Range Atmospheric Transport of Mercury 7
D. Syrakov ……………………………..Bulgaria…. NIMH A. Dastoor, D. Davignon ………………Canada...... MSC-Can J. Christensen…………………………. Denmark…NERI G. Petersen, R. Ebinghaus…………......Germany…GKSS J. Pacyna ………………………………. Norway….. NILU J. Munthe, I. Wängberg ……………….. Sweden….. IVL R. Bullock ………………………………USA………EPA M. Cohen, R. Artz, R. Draxler ………… USA………NOAA C. Seigneur, K. Lohman ………………..USA……... AER/EPRI A. Ryaboshapko, I. Ilyin, O.Travnikov…EMEP…… MSC-E Participants 8
Intercomparison Conducted in 3 Stages • Comparison of chemical schemes for a cloud environment • Air Concentrations in Short Term Episodes • Long-Term Deposition and Source-Receptor Budgets 9
Mace Head, Ireland grassland shore Aspvreten, Sweden forested shore Rorvik, Sweden forested shore Zingst, Germany sandy shore Neuglobsow, Germany forested area Anthropogenic Mercury Emissions Inventoryand Monitoring Sites for Phase II(note: only showing largest emitting grid cells) 11
Mace Head Aspvreten Rorvik Zingst Neuglobsow 12
Neuglobsow NW S SE N NW N NW NW Total Gaseous Mercury at Neuglobsow: June 26 – July 6, 1995 13
Total Gaseous Mercury (ng/m3) at Neuglobsow: June 26 – July 6, 1995 14
Total Particulate Mercury (pg/m3) at Neuglobsow, Nov 1-14, 1999 15
EMEP Intercomparison Study of Numerical Models for Long-Range Atmospheric Transport of Mercury Intro-duction Stage I Stage II Stage III Conclu-sions Chemistry Hg0 Hg(p) RGM Wet Dep Dry Dep Budgets Reactive Gaseous Mercury at Neuglobsow, Nov 1-14, 1999 16
Stage II Publications: 2003 Ryaboshapko, A., Artz, R., Bullock, R., Christensen, J., Cohen, M., Dastoor, A., Davignon, D., Draxler, R., Ebinghaus, R., Ilyin, I., Munthe, J., Petersen, G., Syrakov, D. Intercomparison Study of Numerical Models for Long Range Atmospheric Transport of Mercury. Stage II. Comparisons of Modeling Results with Observations Obtained During Short Term Measuring Campaigns. Meteorological Synthesizing Centre – East, Moscow, Russia. 2005 Ryaboshapko, A., Bullock, R., Christensen, J., Cohen, M., Dastoor, A., Ilyin, I., Petersen, G., Syrakov, D., Artz, R., Davignon, D., Draxler, R., and Munthe, J. Intercomparison Study of Atmospheric Mercury Models. Phase II. Comparison of Models with Short-Term Measurements. Submitted to Atmospheric Environment. 17
Stage III Publication: 2005 Ryaboshapko, A., Artz, R., Bullock, R., Christensen, J., Cohen, M., Draxler, R., Ilyin, I., Munthe, J., Pacyna, J., Petersen, G., Syrakov, D., Travnikov, O. Intercomparison Study of Numerical Models for Long Range Atmospheric Transport of Mercury. Stage III. Comparison of Modelling Results with Long-Term Observations and Comparison of Calculated Items of Regional Balances. Meteorological Synthesizing Centre – East, Moscow, Russia. 19
Conclusions: Uncertainties in Mercury Modeling • Elemental Hg in air - factor of 1.2 • Particulate Hg in air - factor of 1.5 • Oxidized gaseous Hg in air - factor of 5 • Total Hg in precipitation - factor of 1.5 • Wet deposition - factor of 2.0 • Dry deposition - factor of 2.5 • Balances for countries - factor of 2 20