Download
1 / 23
230 likes | 427 Views
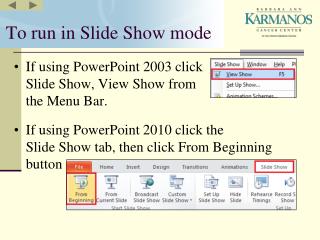
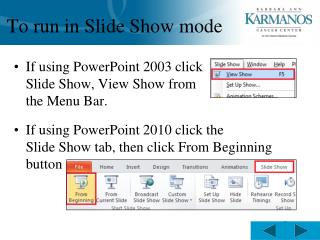
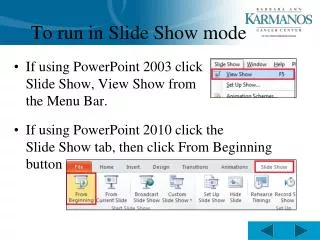
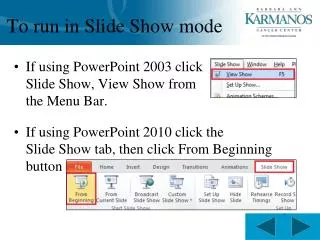
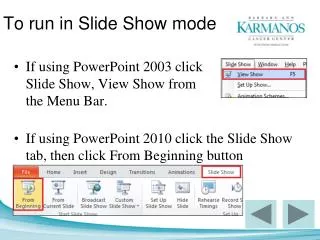
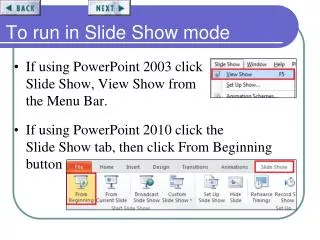
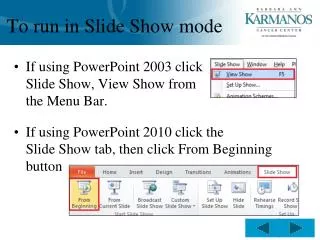
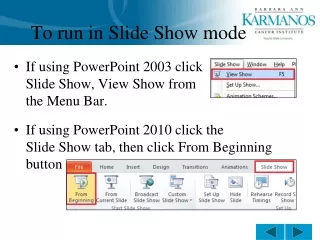
eTransport Walkthrough ... Run Slide Show for full advantage ... Bjorn H. Bakken, PhD bjorn.h.bakken@sintef.no SINTEF Energy Research www.energy.sintef.no www.sintef.no/etransport. SINTEF Energy Research. ... Opening the case. Select existing case from database or press New.

E N D
eTransport Walkthrough ... Run Slide Show for full advantage ... Bjorn H. Bakken, PhD bjorn.h.bakken@sintef.no SINTEF Energy Research www.energy.sintef.no www.sintef.no/etransport SINTEF Energy Research
... Opening the case ... Select existing case from database or press New
Pan & Zoom window Energy system drawing ‘Drag and drop’ component library Operation and investment analysis
1. Set Timesteps ... 1-3 days (24-72 timesteps) per segment are recommended for operational analysis
The sum of Weight over all Segments must equal one year (365 when Timestep is set as 24 hours) 2. Set Segments ... The load and price profiles given for each component is multiplied with the Coefficient for the respective Segment Any number of Segments (seasons) may be specified by clicking New.
3. Set Years ... The Years parameter defines the Investment periods in the case. They do NOT have to be of equal length. The load and price profiles given for each component is multiplied with the Coefficient for each Year
Utility buy-back market Electricity spot market Electricity and heat loads CHP alt. 3: High quality wood waste fired CHP CHP alt. 2: Low quality waste fired CHP Electric peak load boiler CHP alt. 1: Gas fired CHP ... Case layout ... Electricity grid District heating grid
... Heat load ... Technology specific data used by Operational analysis Data used by Investment analysis; included in all components When no parameters are given, this component is valid in all Segments, Years and Investment alternatives
... El source ... These tables are always displayed as a function of the Timesteps setting (here: 24)
... El market ... The El market is an option to sell electricity at a given price (constant or variable). Can also represent a Load.
... Power line ... eTransport uses DC Power Flow to calculate the electricity network flows. Any number of lines and cables may be specified.
... Gas source ... This source is included in Investment alternative CHP1 The pressure setting is only valid when the Gas Source is connected to a Gas Node in a gas network.
... Waste source ... This source is included in Investment alternative CHP2
... Boiler ... The boiler is defined as a separate Investment alternative
Select Edit Investments from the Data menu... ... Investment setup ... ...or Investment Parameters from any component
... Run investment analysis ... Combination & timing of investments: Red=Not allowed Green=Allowed Yellow=Mandatory combinations -> NB: The combination matrix must be evaluated horizontally The report from the AMPL solver can be inspected e.g. to search for deficit penalties or errors
... View results: Investments ... Investment alternatives list; Click to highlight components on drawing screen Choose variables to display
4 types of emissions calculated for all alternatives ... View results: Investments ... Ranked list of investment alternatives Choose variables to display Tree structure shows the components included in each investment alternative
... View results: Operation ... Selected components highlighted on screen - the user can scroll through any combination of Rank, Period and Segment Operational analysis for Rank 1 (CHP 2 + Boiler) ...for Period 2010-2015... Select variables
eTransport Walkthrough Contact: Bjorn H. Bakken, PhD bjorn.h.bakken@sintef.no SINTEF Energy Research www.energy.sintef.no www.sintef.no/etransport