Download
1 / 11
110 likes | 207 Views
Explore the evolution of U.S. economy by analyzing GDP figures from 1990 to 2005, including various approaches. Gain insights into real GDP growth rates and the traditional macroeconomic model.

E N D
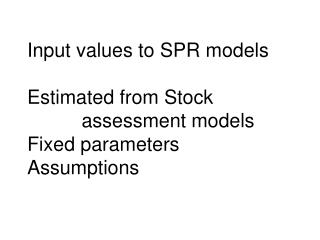
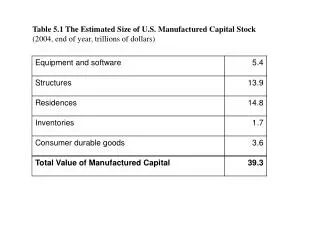
Table 5.1 The Estimated Size of U.S. Manufactured Capital Stock (2004, end of year, trillions of dollars)
Table 5.2 Gross Domestic Product, Product Approach (2005, trillions of dollars)
Table 5.3 Gross Domestic Product, Spending Approach (2005, trillions of dollars)
Table 5.4 Gross Domestic Product, Income Approach (2005, trillions of Dollars)
Table 5.6 Calculation of Constant Dollar Real GDP and Growth Rates (to be continued)
(Continued) Table 5.6 Calculation of Constant Dollar Real GDP and Growth Rates
Table 5.7 Calculation of a Constant Weight Price Index (for Year 2, when Year 1 is Base)
Figure 5.2 The Traditional Macroeconomic Model “Circular Flow” Diagram