Download
1 / 17
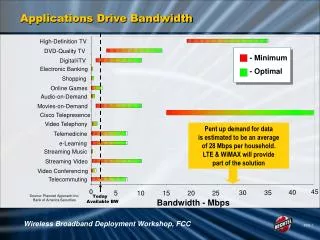
170 likes | 267 Views
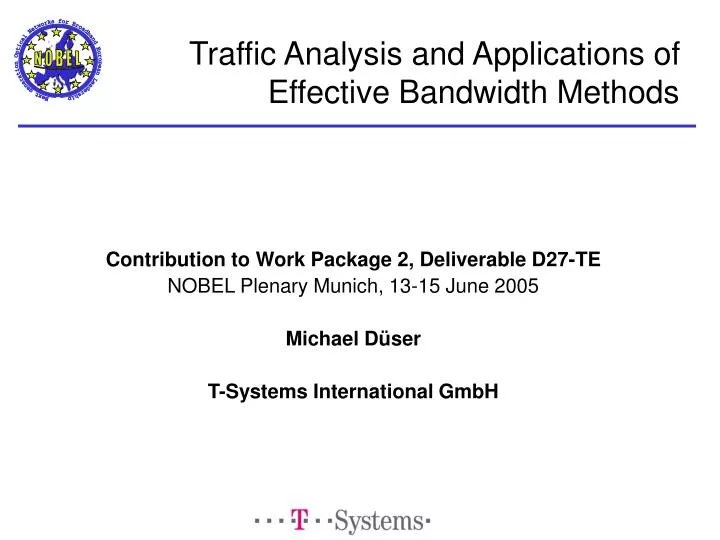
Traffic Analysis and Applications of Effective Bandwidth Methods. Contribution to Work Package 2, Deliverable D27-TE NOBEL Plenary Munich, 13-15 June 2005 Michael Düser T-Systems International GmbH. Contents. Work to be presented: Evaluation of traffic traces (SNMP based measurements)

E N D
Traffic Analysis and Applications of Effective Bandwidth Methods Contribution to Work Package 2, Deliverable D27-TE NOBEL Plenary Munich, 13-15 June 2005 Michael Düser T-Systems International GmbH
Contents Work to be presented: • Evaluation of traffic traces (SNMP based measurements) • UST-IKR • Acreo • Problem to be addressed: Investigation of the traffic asymmetry • Application of the effective bandwidth method for an M/Pareto-model • Multiplexing gain vs. no. users • Required capacity for different services • Standard DSL user • VoIP • IPTV WP2
(Dis)advantages of Traffic Monitoring with SNMP Disadvantages • SNMP data collected over several weeks (polling of router interfaces) • Min. interval between polls: 5 mins (UST-IKR), 1day/2hrs (Acreo); loss of dynamics below that scale • Aggregated traffic only • Virtually unrestricted access speed (FE), contains no DSL-traffic Advantages • Simple (polling of Ethernet switch/router interfaces) • Polling max. every 5mins (medium file size), virtually non-intrusive, .txt file • No violation of privacy rights • SNMP data collected over several weeks (polling of router interfaces) • Route different traffic types over separate interfaces (Acreo) – easy way of separating data! • Average and peak rates available WP2
UST-IKR Traffic Trace800-1000 students connected via FE to GE Here: one-week example; total measurement period approximately 3 months (with interruptions). WP2
Acreo Traffic TracesSeparate traces for IP/VoIP and IPTV, 160 users connected via FE Internet/VoIP traffic only IPTV traffic only WP2
SNMP Traffic Trace AnalysisDown-/Upstream Asymmetry • Metric: traffic asymmetry, i.e. the ratio down-/upstream per measurement interval • Why asymmetry? • Important design consideration for metro-/access network technology e.g. A-DSL is asymmetric by definition • For both UST-IKR and Acreo users had symmetrical FE access • Important difference to standard residential users: • No upper limit on bandwidth (theoretically, at least >1…3Mbps • Symmetric access, users were not restricted by asymmetric access technology • In the following: Log10-plot of asymmetry histograms WP2
Asymmetry factor approx. 2 (more down- than upstream) Gaussian fit, stddev approx. 2.0; Hence: PDF of asymmetry follows a log-normal distribution But: Missing an interpretation why the distribution is Gaussian Traffic Asymmetry Distribution (Histogram and fit, UST-IKR) Average traffic rates Peak traffic rates WP2
Asymmetry factor approx. 0.63, (more up- than downstream traffic) Gaussian fit (expect for one peak), stddev approx. 1.9 Traffic Asymmetry Distribution (Histogram and fit, Acreo, IP-traffic only) Average traffic rates Peak traffic rates WP2
Statistical Model IThe M/Pareto model for media applications (Bodamer/Charzinski, ITCSS 2000) Model assumptions: • Poisson arrival process (OFF periods), does hold e.g.: • VoIP: 50 packets per second • MPEG-4: e.g. 25 frames per second • Pareto distributed activity periods at peak rate (ON periods), i.e. the number of bits per MPEG frame or VoIP packet may vary significantly • Superposition of large number of such sources yields long-range dependent process • Estimates for buffer overflow available • details omitted here • 4 different solutions available, accuracy differs with traffic parameters • Focus in the following on the worst-case assumption (i.e. minimum multiplexing gain achievable for a bufferless system) • Advantage: analytical results can easily be obtained • But: results require confirmation through simulation to determine area for which the approximation is valid WP2
Statistical Model IIKey input/output parameters of the M/Pareto model Input: • The ratio of traffic rate mean to peak. • The ratio of buffer size to mean burst size (e.g. MPEG frame size). • Hurst parameter. • Buffer overflow probability. Output: • Bandwidth required to satisfy the required overflow probability as multiple of the mean traffic rate (== effective bandwidth!) • Continuous bandwidth vs. SONET/SDH chunks (VC12/VC3/VC4) WP2
Impact of Effective BandwidthM/Pareto model estimate for conventional T-DSL user Parameters: • Buffer size/burst length = 50 • Peak/mean rate = 10 • Overflow prob. = 10-6 Multiplexing gain Reduction in required (reserved) capacity per active source Approximations plotted • REM: Rate envelope multi- plexing • FF: Fluid flow model • FBM: Fractional Brownian motion • CM: Combined FBM WP2
Required Capacity for Standard DSL Users Values per user: Mean: 100 kbps Peak: 1000 kbps WP2
VC-3 Multiplex Gain VoIP UsersComparison of required bandwidth for 64 kbps POTS vs. 8 kbps codec WP2
1Mb A-DSL Video IMean bit rate of MPEG-4 sample traces at different quality levels Source: TKN, TU Berlin (Prof. Wolisz), Berlin, Germany WP2
Typical web traffic Poisson traffic Video IIHurst parameter H of MPEG-4 sample traces at different quality levels Source: TKN, TU Berlin (Prof. Wolisz), Berlin, Germany WP2
10 x VC-4 Required Capacity for MPEG-4 UsersParameters as in previous slides REM approximation WP2
Summary & Future Work • Evaluation of UST-IKR and Acreo SNMP traffic traces: • Sampling 5 minutes; hence only slowly varying statistics • UST-IKR: Higher downstream traffic (factor 2.0) • Acreo: Higher upstream traffic (factor 1.6) • Metric: asymmetry • Log10(asymmetry) histogram Gaussian-shaped (interpretation pending) • TBD: Detailed UST-IKR data set… • First evaluation of application of effective bandwidth methods • M/Pareto model (analytical approach) • Used to determine required capacity for standard DSL-User, VoIP and MPEG-4 coded video at DSLAM/LER location • TBD: check applicability of M/Pareto model, compare to Guerin/Kelly approaches & moderate deviations approach (e.g. UST-IKR results) WP2