Download
1 / 64
640 likes | 879 Views
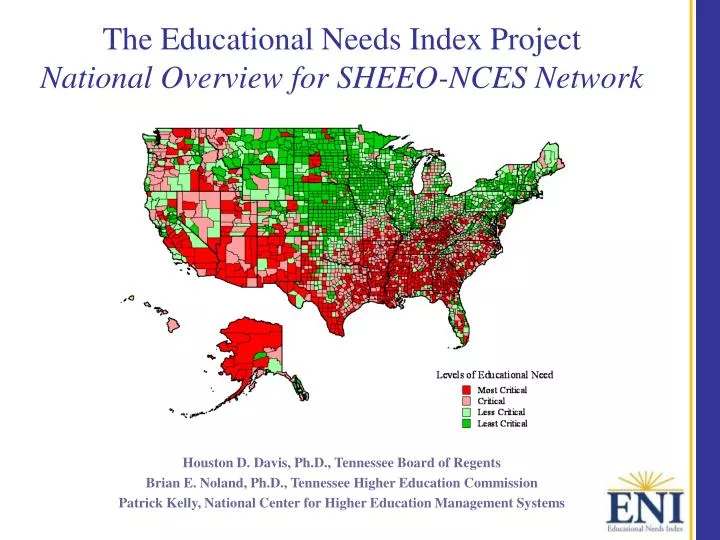
The Educational Needs Index Project National Overview for SHEEO-NCES Network. Houston D. Davis, Ph.D., Tennessee Board of Regents Brian E. Noland, Ph.D., Tennessee Higher Education Commission Patrick Kelly, National Center for Higher Education Management Systems. Additional thanks to:

E N D
The Educational Needs Index ProjectNational Overview for SHEEO-NCES Network Houston D. Davis, Ph.D., Tennessee Board of Regents Brian E. Noland, Ph.D., Tennessee Higher Education Commission Patrick Kelly, National Center for Higher Education Management Systems
Additional thanks to: Tennessee Board of Regents Tennessee Higher Education Commission National Center for Higher Education Management Systems Austin Peay State University This research is sponsored by:
Educational Needs Index Project Development - Background • Foundation developed in late 1990’s as a means to evaluate educational challenges in Tennessee • Tennessee Tomorrow and the Tennessee P-16 Council • Journal of Social Indicators Research (February 2003) • Southern Governors Association (October 2003) • SREB Adult Learning initiative (2004) • Lumina grant submission and receipt (2004-05) • Base project and regional policy audits (2005-06)
Educational Needs Index Foundational Constructs • Education and the economy are increasingly intertwined as human capital becomes a centerpiece of the knowledge economy. • State budgets are increasingly challenged by fluctuating state revenues. • The demographic characteristics of the states are not uniform from region to region. The current use of only state-level indicators in the planning process limits the ability of planners to differentiate between the various regions of the nation. • Educational planning indicators need to be linked with economic and demographic variables to provide a legitimate representation of our citizens.
Human Capital Theory • Individuals and society derive economic benefits from human capital investments in people. • Based on the notion that education increases the human capital stock of individuals, improves their productivity, leads to increases in economic productivity, and contributes to the general betterment of society. (Denison 1983; Walberg and Zhang 1998). • The advancement of educational attainment has become an indispensable variable in policy efforts to make improvements of society as a whole.
The Knowledge Economy and Higher Education • In the Knowledge Economy, education, technology, and learning are the keys to sustainable economic growth. • Higher education provides the foundation for the Knowledge Economy. • Elected officials must remain diligent in their efforts to make significant investments in their educational infrastructures. • In order to remain competitive, states must work to develop policies that incorporate human, intellectual, and financial capital.
Educational Needs Index Foundational Constructs • Education and the economy are increasingly intertwined as human capital becomes a centerpiece of the knowledge economy. • State budgets are increasingly challenged by fluctuating state revenues. • The demographic characteristics of the states are not uniform from region to region. The current use of only state-level indicators in the planning process limits the ability of planners to differentiate between the various regions of the nation. • Educational planning indicators need to be linked with economic and demographic variables to provide a legitimate representation of our citizens.
Educational Needs Index Foundational Constructs • Education and the economy are increasingly intertwined as human capital becomes a centerpiece of the knowledge economy. • State budgets are increasingly challenged by fluctuating state revenues. • The demographic characteristics of the states are not uniform from region to region. The current use of only state-level indicators in the planning process limits the ability of planners to differentiate between the various regions of the nation. • Educational planning indicators need to be linked with economic and demographic variables to provide a legitimate representation of our citizens.
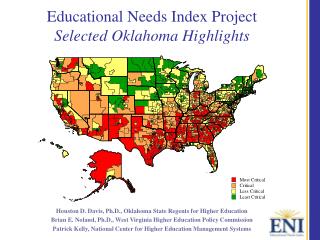
Education Factors - Percent of 18-64 Year Olds with a High School Diploma, 2000 Data Source: U.S. Census Bureau, 2000 Census
Economic Factors – Percent of the Population Age 64 and Under Living in Poverty, 1999 Data Source: U.S. Census Bureau, 2000 Census
Market Factors – Projected Percent Change in the Population Age 64 and Under, 2000-2020
Educational Needs Index Foundational Constructs • Education and the economy are increasingly intertwined as human capital becomes a centerpiece of the knowledge economy. • State budgets are increasingly challenged by fluctuating state revenues. • The demographic characteristics of the states are not uniform from region to region. The current use of only state-level indicators in the planning process limits the ability of planners to differentiate between the various regions of the nation. • Educational planning indicators need to be linked with economic and demographic variables to provide a legitimate representation of our citizens.
Improving the Policy Toolbox • The geographic and demographic diversity of the nation provides challenges to those planning for the delivery of private or public goods and services. • As recently noted by the Southern Growth Policies Board, states need to build and maintain a more complete demographic profile of their workforce … • This profile should take into account the educational, economic, and population growth factors of all counties in the region, thereby providing a clear picture of workforce opportunities and challenges. • The purpose of this research is to develop an econometric model that answers this call, thereby providing direct evidence of the link between education and social welfare.
Educational Needs Index Model Development and Construction • Model examines the connections between educational, economic, and population characteristics at the county level • Combines 15 county level variables that directly impact • Participation rates in post-secondary education • Educational attainment levels • Employment patterns • Socio-economic status • Provides for state, regional, and national comparisons
Educational Needs Index Factor Categories • Educational Factor – Indicators assess the educational capacity of a county’s adult population. • Economic Factor - Indicators in this category assess the degree of economic challenges and opportunities facing counties. • Market Demand Factor - Indicators assess the present population growth issues facing the county and potential need for increased emphasis on human capital development to address changing demographics of a county. • Population Factor – Indicators serve as corrective variables to control for the population size of each respective county.
Educational Needs Index Key Questions • What is the current level of educational attainment of the state and its respective counties? • What is the current health of each state’s counties from an economic perspective? • Are there counties in the state that are quickly growing and have shifting demographics that skew toward youth, young adults, or at-risk minority populations? • What counties in the state can be identified by the ENI to be under-educated, facing economic challenges, and facing robust population growth and shifting demographics in categories of youth, young adults, or at-risk minority populations?
Educational Needs Index ModelThe Education Factor and Its Four Indicators
Educational Needs Index ModelThe Economic Factor and Its Five Indicators
Educational Needs Index ModelThe Market Demand Factor and Its Five Indicators(plus the Population Adjustment)
Educational Needs Index Project Final report to be published by Lumina and include national highlights, region profiles, analysis of best practices, and policy recommendations.
Educational Needs Index (ENI) and Examples of Supporting Data Employed in Regional Policy Audits Southeastern Kentucky and Northeastern Tennessee
Southeastern Kentucky and Northeastern Tennessee Counties and 5% PUMS Areas – High ENI Region Kentucky Counties Bell Harlan Knox Whitley Tennessee Counties Campbell Claiborne Hancock Morgan Scott
Educational Needs Index – Average Index Scores for Each Measure, Southeastern KY and Northeastern TN Low Need High Need Percent 18-64 Year Olds with a High School Diploma (%) 2000 Percent 25-64 Year Olds with an Associates Degree (%) 2000 Education Factors Percent 25-64 Year Olds with a Bachelor's Degree or Higher (%) Difference in College Attainment Between Young and Older Unemployment Rate (%) 2003 Percent of Population Under 65 In Poverty (%) 2000 Median Family Income 2000 ($) Economic Factors Per Capita Personal Income - 2000 ($) Percent Manufacturing Employment (%) 2000 Projected Percent Change in 64 and Under Population 2000 to 2020 Percent of Population Ages 0 to 19 (%) - 2000 Market Factors Percent of Population Ages 20 to 44 (%) - 2000 Rate of Population Growth 64 and Under (1990 to 2000) Percent Minority (%) 2000 Population Adjustment Percent of State Population Ages 0 to 44 (%) -1 -0.5 0 0.5 1 1.5 2 2.5