Download
1 / 29
290 likes | 422 Views
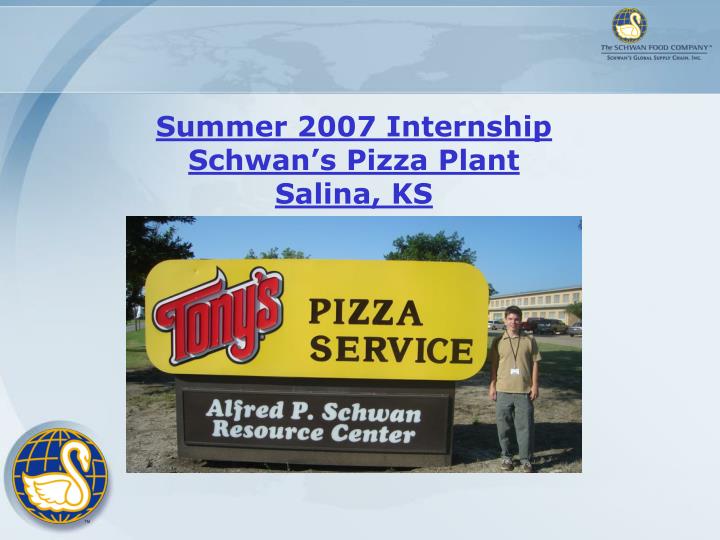
Summer 2007 Internship Schwan’s Pizza Plant Salina, KS. Presentation Outline. Background Projects Air Leak Audit Hand Washing Sink Audit Water Trough Audit Statistical Process Control Reflection. Andrew Sellers. Born in Salina B.S. – Industrial Engineering at KSU Grad Date: Dec. 2005

E N D
Presentation Outline • Background • Projects • Air Leak Audit • Hand Washing Sink Audit • Water Trough Audit • Statistical Process Control • Reflection
Andrew Sellers • Born in Salina • B.S. – Industrial Engineering at KSU • Grad Date: Dec. 2005 • Master’s – Business Admin. at KSU • Expected Grad. Date: May 2008 • Pollution Prevention Institute Intern • Career Interests • Finance • Alternative Energy
Energy Reduction Projects • Air Leak Audit • Hand Washing Sink Audit • Water Trough Audit • Statistical Process Control – Analysis of Topping Weights
Air Leak Audit • Identified 46 leaks costing Schwan’s $23,000+ in electricity • Common locations: • Water Traps • Air Hoses • Air Hose Nozzles • Created maintenance notifications to repair leaks • Created Air Leak Audit Procedure for future audits • Predictive Maintenance order will come up every 6 months in SAP
Water Audit – Information Gathered • Created map of all sinks in the plant • Flow Rates – Continuously Running Water • Flow Rates - Water Troughs • Costs associated with wasted water
Water Project Assumptions • Water Cost – $1.97 per CCF • Natural Gas Cost - $7.00 per DTH • Assumed incoming temp was 50oF • Assumed boiler operates @ 60% efficiency • WWTP Cost – $2.97 per 1000 gallons • Conservative estimate without Fixed Costs • Assumed 20% usage of hand washing sinks
Hand Washing Sink Audit • 53 sinks in plant • 36 had continuously running water • Why? - To keep water at 100oF • Average Annual Cost: • Water/sink: $373.89 • Energy/sink: $788.25 • WWTP/sink: $421.66 • Average Total Cost of Continuously Running Water per sink: $1,583.80
Alternatives • Grundfos Comfort System • Installed on sample sink • Could not guarantee 100oF • Could not overcome any pressure difference • Stiebel Eltron Tempra 20 • Instantaneous Electric Water Heater • Minimum Water Flow is 2.2 GPM • Can Handle 60oF Temperature Rise at 2.2 GPM • Cold Water In, 100+oF Out
Tempra 20 Costs vs. Savings – Per Sink • Initial Costs $2,500 • Unit: $720 • Installation: $780 • Electrical: $1,000 • Annual Savings $654 • Water $374 • Energy $788 • WWTP $422 • Electric vs. Gas ($930)
Instantaneous Water Heater Cash Flows Cost of Capital: 12% Payback Period: 3 years 9.9 months NPV (5 years only): -143 Recommended
Water Trough Study • Performed time study for 30 minutes @ West Entrance – North Trough • 59 gallons were wasted • Assume same waste every 30 minutes for 18 hours a day… • Water Cost: $2,054 • Energy Cost: $4,351 • WWTP Cost: $2,316 • Total Cost: $8,721
Recommendations • Remove water troughs at West Entrance and replace each with freestanding sinks • Superior Plumbing quotes: • 4 sinks: $5,800 • 8 sinks: $11,300 • Payback Period < 1 year Recommended
Blast 2 Canadian Bacon Veggies Pepperoni Mushroom Sausage Blast 7 Cheese Pepperoni Sauce Blast 3 Line 1 Cheese Line 2 Cheese Statistical Process Control
Method • Collect Data • Measure topping weights on all lines • 5 Trays at a time • Collect 40 samples (Blast 7 – 20 samples) • Analyze Data • Minitab • Control Charts • Normality Tests • Process Capability
What We Found • Machines are not applying toppings evenly – Need to balance! • Excess Toppings totaling $276,000/year • $200,000 from Blast 3 Line 1 Cheese • Quality Issues • Under applying toppings amounts to $365,000/year • Cuts costs, but could lead to unsatisfied customers
Blast 3 – Line 1 Cheese Mean = Target Mean >> Target
Blast 3 – Line 2 Cheese Mean = Target Mean < Target
Recommendations - SPC • Continue to collect topping data – it is extremely useful in locating sources of waste • Standardize measuring trays – We noticed a ¼” difference in diameter of trays being used for the same pizza size • Make machine adjustments to balance lines – Could save lots of $$$
Reflection • What I have learned • Network • Determine who to turn to for questions ASAP within Schwan’s and outside of Schwan’s • Communication • Learning to be assertive • Project Management • Manage time to ensure completion of projects • Information Gathering • Takes time, but necessary to justify projects
Acknowledgements • People who have provided me with valuable info: • Jon Robertson • Chris Sharpe • Jay Reimer • Chris Harapat (Superior Plumbing) • Randy Simmons • Cathy Raymer • Garry Waldren • Chuck Thornberg • Brian Beier • Phillip Richardson • Bryan Downie