Evaluation of Estradiol Supplementation Effects on Growth in a Japanese Female Patient
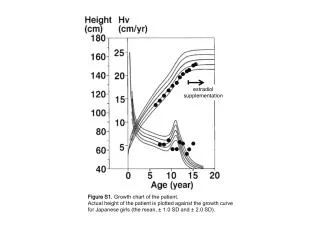
This study presents a growth chart documenting the patient’s actual height compared to growth curves established for Japanese girls. Key statistical results, including p-values, are provided to assess significance across various measurements. Additionally, the in vitro reporter assay highlights the interaction between SOX10 and PAX3 expression vectors on the MITF promoter, revealing that the p.Pro169fsX117 mutant has limited transactivation capacity. This research aims to elucidate the impacts of estradiol supplementation on growth and gene expression in clinical settings.

Evaluation of Estradiol Supplementation Effects on Growth in a Japanese Female Patient
E N D
Presentation Transcript
estradiol supplementation Figure S1. Growth chart of the patient. Actual height of the patient is plotted against the growth curve for Japanese girls (the mean, ± 1.0 SD and ± 2.0 SD).
p = 0.78 p = 0.06 p = 0.20 p = 0.97 p = 0.02 p = 3.2×10⁻⁷ p = 1.2×10⁻⁷ p = 1.1×10⁻⁴ p = 7.0×10⁻⁷ p = 1.1×10⁻¹³ Relative fold induction Relative fold induction p = 6.0×10⁻⁸ p = 2.0×10⁻⁷ WT (ng/well) 0 2020 100 WT (ng/well) 0 2020 100 MT (ng/well) 0 0 20 10 20 MT (ng/well) 0 0 20 10 20 PAX3 (-) PAX3 (+) Figure S2. In vitro reporter assay using a luciferase vector containing the MITF promoter. The SOX10 expression vectors were transfected with (right panel) or without (left panel) the PAX3 expression vector. The results are expressed as the mean ± one standard deviation. The p.Pro169fsX117 mutant (MT) barely transactivated the MITF promoter and exerted no dominant-negative effects on the wildtype (WT) SOX10 protein. As controls for the expression vectors, an empty counterpart vector was transfected.