Download
1 / 37
370 likes | 672 Views
2007: 12 billion Euro investment. annual rate of growth since 1995: 30% The European Experiance - Why does the EU support Renewable Energy Sources (RES) ...

E N D
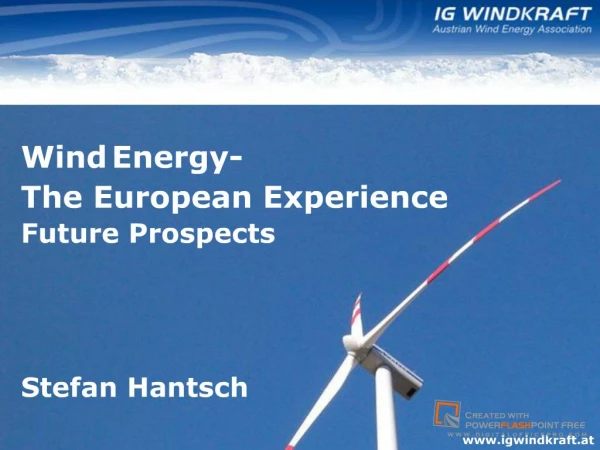
Slide 1:Wind Energy- The European Experience Future Prospects Stefan Hantsch www.igwindkraft.at
Slide 2:IG Windkraft �Austrian Wind Energy Association
founded in 1993 2.000 members all important manufacturers and operators board member of European Organisations EWEA and EREF www.igwindkraft.at
Slide 3:Austria
small landlocked country 8 Mio. inhabitants 84.000 km� (1% of Brazil) 982 MW wind power www.igwindkraft.at
Slide 4:Windpower Worldwide
Source: GWEC
Slide 5:Windpower in Europe
Source: EWEA End of 2007: 56,000 MW installed 110 billion kWh- 3.5% of consumption Installed 2007:8,500MW 2007: 12 billion Euro investment annual rate of growth since 1995: 30%
Slide 6:The European Experiance - Why does the EU support Renewable Energy Sources (RES)?
dependency - price risk � costs - CO2 www.igwindkraft.at ->Clear political decisions to foster energy production by Renewable Energy Sources
Slide 7:The European Experiance - Why does the EU support RES?
www.igwindkraft.at ->2002: EU Directive to get 21% of the electricity consumption by Renewable Energy Sources (RES) in 2010
Slide 8:The European Experiance - Why does the EU support RES?
www.igwindkraft.at EU- Head of states 2007 agreed on new binding target: ->20% (today 8%) of the whole energy consumption has to be be covered by Renewable Energy Sources (RES) in 2020 ->Every member-state has to make a plan how to reach its target. ->To get 20% of the whole energy-consumption you need 34% RES electricity (today 17%). ->20% CO2 reduction
Slide 9:Wind energy in Europe end 2007
Source: EWEA
Slide 10: Feed in Tariffs (REFIT) The producer of green electricity gets a fixed price for the produced electricity for a period of several years typical:(10-20 years) (7-10 � ct/kWh) Purchase obligation: the power is purchased by grid operators and then proportionately distributed to consumers Guaranteed and regulated grid-access
Support mechanism in Europe
Slide 11:What is the result of these clear decissions?
Slide 12:Wind-turbine Size
Slide 13:Wind-power: High tech technology
Slide 14:Wind-power: High tech technology
Slide 15:New power plants in Europe: Wind is N�1
Source: EWEA and Platts Power Vision
Slide 16:New power plants in Europe: Wind is N�1
Source: EWEA and Platts Power Vision
Slide 17:Wind power becomes competitive
XXX http://www.e-control.at/servlet/page?_pageid=187&_dad=econtrol&_schema=ECONTROL&_type=site&_fsiteid=193&_fid=112614&_fnavbarid=1&_fnavbarsiteid=193&_fedit=1&_fmode=2&_fdisplaymode=1&_fcalledfrom=1&_fdisplayurl=XXX http://www.e-control.at/servlet/page?_pageid=187&_dad=econtrol&_schema=ECONTROL&_type=site&_fsiteid=193&_fid=112614&_fnavbarid=1&_fnavbarsiteid=193&_fedit=1&_fmode=2&_fdisplaymode=1&_fcalledfrom=1&_fdisplayurl=
Slide 18:Wind power becomes competitive
The support needed per kWh is decreasing XXX http://www.e-control.at/servlet/page?_pageid=187&_dad=econtrol&_schema=ECONTROL&_type=site&_fsiteid=193&_fid=112614&_fnavbarid=1&_fnavbarsiteid=193&_fedit=1&_fmode=2&_fdisplaymode=1&_fcalledfrom=1&_fdisplayurl=XXX http://www.e-control.at/servlet/page?_pageid=187&_dad=econtrol&_schema=ECONTROL&_type=site&_fsiteid=193&_fid=112614&_fnavbarid=1&_fnavbarsiteid=193&_fedit=1&_fmode=2&_fdisplaymode=1&_fcalledfrom=1&_fdisplayurl=
Slide 19:Costs of producing electricity
Wind Energy Costs
Slide 20:Renewables stabilise electricity prices
Slide 21:Will prices continue to rise? Electricity prices depend very strong on commodity prices.
What brings the future?
Next slides are based on a presentation of: Dr. Werner Zittel, Ludwig-B�lkow-Systemtechnik GmbH, Germany (zittel@lbst.de) www.energiekrise.de Oil yield time 1st field 2 field 3rd field Development of Oil Production Maximum Jahr Mrd m3/Jahr Vergangenheit Prognose Quelle: DTI, M�rz 2007; Prognose: LBST Beitrag der j�hrlich neu erschlossenen Gasfelder Uk � Gasf�rderung: Seit 2001 geht die F�rderung zur�ck ? Neue Gasfelder Nettof�rderung (BP Stat Rev)Slide 25:Future gas supply in Europe?
Source: Ludwig-B�lkow-Systemtechnik; Dr. Werner Zittel
Slide 26:Study: (A.T. Kearney (2007) In the years 2005-2020 The european gas production increases by 43% (247 bill. m� to 140 bill. m�) Demand rises by 26% (514 bill. to 650 Mrd.m�) Imports will double (267 auf 510 bill. m�) Additional demand of Imports: 243 bill.m�
Future gas supply?
Slide 27:There are new pipelines planned, but they could only supply about 100 bill. m� Not even the half of the demand
Future gas supply? Source: Ludwig-B�lkow-Systemtechnik; Dr. Werner Zittel
Slide 28:There are doubts that new pipelines really can bring new gas. Maybe they just bypass the Ukraine (Financial Times 10.3.08) Priority for the own economy. A 10 bill.m� pipeline from Sakhalin-1 field to China was stopped in 2007 (bloomberg) A small delay in developing new fields can decrease the output substiancially
Future gas supply?
Slide 29:Development of new LNG- Terminales postponed (Qatar) Priority for the gas supply of the own economy Nigeria und Egypt rethink LNG-projects in the volume of 33% of today�s global market Indonesia will reduce LNG-Exports by 75% in 2010 Not only Europe needs more gas China, India, North America LNG (Liquified Natural Gas)
Can LNG close the gap?
Slide 30:LNG makes natural gas to a good which is tradeable across the world. Global competition will boost prices rapidly
Can LNG close the gap?
Slide 31:Huge problems in Australia and South Africa China and Vietnam became coal net importers in 2007 The official coal reserves are very often unrealistic In the last 20 years the global reserves have been reduced by 25% India reduced its reserves by 40% in 2007 Since 1992 the reported reserves of China have been unchanged
No Gas � More Coal?
Slide 32:Grafik Kohlepreis newc
More coal? � prices are exploding
Slide 33:Therefore: bright prospects for wind energy
EWEA-Study 2005 12% Windpower in 2020 World 12% electricity production (billion kWh) 3,054 Installed wind power capacity (MW) 1.254,000 Annual installed capacity (MW) 159,000 Employment (million job-years) 2.3
Slide 34:Therefore: bright prospects for wind energy
Source: EWEA
Source: EWEASlide 35:Therefore: bright prospects for wind energy
Slide 36:Therefore: bright prospects for wind energy
Source: EWEA
www.igwindkraft.at Thank you for the possibility to come to your wonderful country! More information: www.igwindkraft.at s.hantsch@igwindkraft.at