Download
1 / 10
100 likes | 572 Views
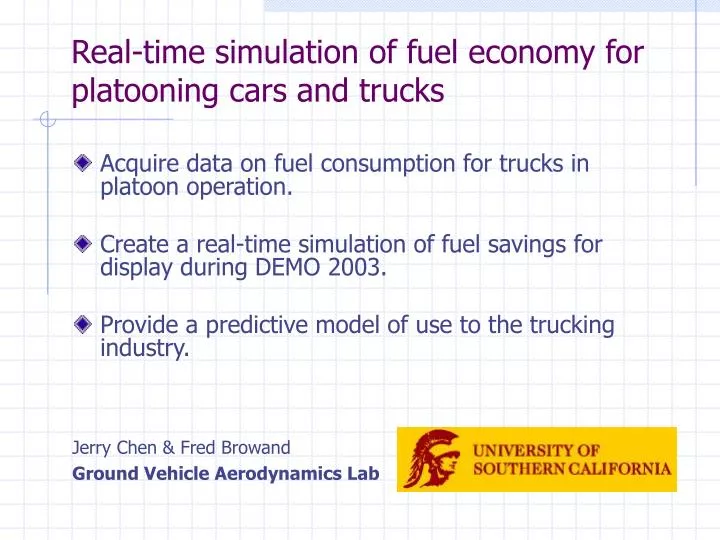
Real-time simulation of fuel economy for platooning cars and trucks. Acquire data on fuel consumption for trucks in platoon operation. Create a real-time simulation of fuel savings for display during DEMO 2003. Provide a predictive model of use to the trucking industry.

E N D
Real-time simulation of fuel economy for platooning cars and trucks • Acquire data on fuel consumption for trucks in platoon operation. • Create a real-time simulation of fuel savings for display during DEMO 2003. • Provide a predictive model of use to the trucking industry. Jerry Chen & Fred Browand Ground Vehicle Aerodynamics Lab
Collect data on fuel consumption for trucks in platoon operation • Broadcast fuel rate (cm3/sec) and wheel speed outputs on SAE J1939 serial data link are adequate to provide instantaneous fuel consumption in liters/kilometer (or gallons/mile). • Cummins estimates absolute accuracy of broadcast fuel rate to be within ± 3% of output value. • The relative measurement (for each truck): (fuel consumption)platoon/(fuel consumption)isolation will be much more accurate. Both these measurements must follow one another under identical ambient wind and temperature conditions.
Provide a predictive model of use to the trucking industry • Fuel saving in platoon travel arises solely from a decreased aerodynamic drag. • Predictive models for fuel savings are related to drag savings. • Example: FC = fuel consumption, p-platoon, a-isolation r = rolling resistance, dz/ds = road gradient Wt, S, U, ρ = weight, area, velocity, air density
Provide a predictive model of use to the trucking industry • Infer drag changes from changes in fuel consumption for operating platoon. • Compare field measurements with our wind tunnel measurements for two close following trucks. • Evaluate and resolve inconsistencies.
The drag of a single body with and without rounded vertical edges W: H: L (w/attachment) 1: 1.4: 4.2 (4.5) W: Ground Clearance 1: 0.28 CD = 0.94 .02 U = 26 m/s Re = UW/ = 267,000 Blockage corrections based upon local q derived from wall-static pressure CD = 0.51 .01
Drag versus separation BLUNT-BLUNT BLUNT-ROUNDED ROUNDED-ROUNDED ROUNDED-BLUNT
No less savings Bonnet & Fritz field test No greater savings Total drag summary BLUNT - ROUNDED ROUNDED - ROUNDED BLUNT - BLUNT ROUNDED - BLUNT
Work effort next 9 months • Acquire additional data from single truck runs, and evaluate data quality. Assist as needed. Be available for wind, temperature measurement. (0-4 months) • Acquire data for platoon of trucks, and evaluate data quality. Record wind, temperature. Input data into our most recent display program. (4-9 months) • Continue to improve animated display. (0-9 months) • Other suggestions. Animation schemes welcome.