Download
1 / 46
1.12k likes | 2k Views
Machine Learning Dimensionality Reduction. Some slides thanks to Xiaoli Fern (CS534, Oregon State Univ., 2011).

E N D
Machine LearningDimensionality Reduction Some slides thanks to Xiaoli Fern (CS534, Oregon State Univ., 2011). Some figures taken from "An Introduction to Statistical Learning, with applications in R" (Springer, 2013) with permission of the authors, G. James, D. Witten, T. Hastie and R. Tibshirani.
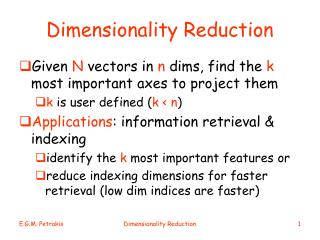
Dimensionality reduction • Many modern data domains involve huge numbers of features / dimensions • Documents: thousands of words, millions of bigrams • Images: thousands to millions of pixels • Genomics: thousands of genes, millions of DNA polymorphisms
Why reduce dimensions? • High dimensionality has many costs • Redundant and irrelevant features degrade performance of some ML algorithms • Difficulty in interpretation and visualization • Computation may become infeasible • what if your algorithm scales as O( n3 )? • Curse of dimensionality
Approaches to dimensionality reduction • Feature selection • Select subset of existing features (without modification) • Lecture 5 and Project 1 • Model regularization • L2 reduces effective dimensionality • L1 reduces actual dimensionality • Combine (map) existing features into smaller number of new features • Linear combination (projection) • Nonlinear combination
Linear dimensionality reduction • Linearly project n-dimensional data onto a k-dimensional space • k < n, often k << n • Example: project space of 104 words into 3 dimensions • There are infinitely many k-dimensional subspaces we can project the data onto. • Which one should we choose?
Linear dimensionality reduction • Best k-dimensional subspace for projection depends on task • Classification: maximize separation among classes • Example: linear discriminant analysis (LDA) • Regression: maximize correlation between projected data and response variable • Example: partial least squares (PLS) • Unsupervised: retain as much data variance as possible • Example: principal component analysis (PCA)
Unsupervised dimensionality reduction • Consider data without class labels • Try to find a more compact representation of the data
Principal component analysis (PCA) • Widely used method for unsupervised, linear dimensionality reduction • GOAL: account for variance of data in as few dimensions as possible (using linear projection)
Geometric picture of principal components (PCs) • First PC is the projection direction that maximizes the variance of the projected data • Second PC is the projection direction that is orthogonal to the first PC and maximizes variance of the projected data
PCA: conceptual algorithm • Find a line, such that when the data is projected onto that line, it has the maximum variance.
PCA: conceptual algorithm • Find a second line, orthogonal to the first, that has maximum projected variance.
PCA: conceptual algorithm • Repeat until have k orthogonal lines • The projected position of a point on these lines gives the coordinates in the k-dimensional reduced space.
Steps in principal component analysis • Mean center the data • Compute covariance matrix • Calculate eigenvalues and eigenvectors of • Eigenvector with largest eigenvalue 1 is 1st principal component (PC) • Eigenvector with kth largest eigenvalue k is kth PC • k / ii = proportion of variance captured by kth PC
Applying a principal component analysis • Full set of PCs comprise a new orthogonal basis for feature space, whose axes are aligned with the maximum variances of original data. • Projection of original data onto first k PCs gives a reduced dimensionality representation of the data. • Transforming reduced dimensionality projection back into original space gives a reduced dimensionality reconstruction of the original data. • Reconstruction will have some error, but it can be small and often is acceptable given the other benefits of dimensionality reduction.
PCA example (1) mean centered data with PCs overlayed original data
PCA example (1) original data projected Into full PC space original data reconstructed using only a single PC
PCA example: face recognition • A typical image of size 256 x 128 pixels is described by 256 x 128 = 32768 dimensions. • Each face image lies somewhere in this high-dimensional space. • Images of faces are generally similar in overall configuration, thus • They cannot be randomly distributed in this space. • We should be able to describe them in a much lower-dimensional space.
Face recognition in eigenface space (Turk and Pentland 1991)
PCA: a useful preprocessing step • Helps reduce computational complexity. • Can help supervised learning. • Reduced dimension simpler hypothesis space. • Smaller VC dimension less risk of overfitting. • PCA can also be seen as noise reduction. • Caveats: • Fails when data consists of multiple separate clusters. • Directions of greatest variance may not be most informative (i.e. greatest classification power).
Scaling up PCA • Practical issue: covariance matrix is n x n. • E.g. for image data = 32768 x 32768. • Finding eigenvectors of such a matrix is slow. • Singular value decomposition (SVD) to the rescue! • Can be used to compute principal components. • Efficient implementations available, e.g. MATLAB svd.
Singular value decomposition (SVD) X = USVT
Singular value decomposition (SVD) X = USVT
SVD for PCA • Create mean-centered data matrix X. • Solve SVD: X = USVT. • Columns of V are the eigenvectors of sorted from largest to smallest eigenvalues. • Select the first k columns as our k principal components.
Partial least squares (PLS) • Supervised alternative to PCA. • Attempts to find set of orthogonal directions that explain both response and predictors.
PLS algorithm • First direction: • Calculate simple linear regression between each predictor and response. • Use coefficients from these regressions to define first direction, giving greatest weight to predictors which are highly correlated with response (large coefficients). • Subsequent directions: • Repeat regression calculations on residuals of predictors from preceding direction.
PLS vs. PCA solid line – first PLS direction dotted line – first PCA direction
Partial least squares • Popular in chemometrics. • Large number of variables from digitized spectrometry signals. • In regression tasks, PLS doesn’t necessarily perform better than ridge regression or pre-processing with PCA. • Less bias, but may increase variance.
Random subspace projection • High-dimensional data is projected onto low-dimensional subspace using a random matrix whose columns have unit length. • No attempt to optimize a criterion, e.g. variance. • Preserves structure (e.g. distances) of data with minimal distortion. • Computationally cheaper than PCA.
Random subspace projection • Shown to be competitive with PCA for dimensionality reduction in several tasks • Face recognition • Document retrieval • Also useful for producing perturbed datasets as inputs for ensembles.
Nonlinear dimensionality reduction • Data often lies on or near a nonlinear low-dimensional surface • Such low-dimensional surfaces are called manifolds.
t-Stochastic neighbor embedding (t-SNE) • Visualizes high-dimensional data in a 2- or 3-dimensional map. • Better than existing techniques at creating a single map that reveals structure at many different scales. • Particularly good for high-dimensional data that lie on several different, but related, low-dimensional manifolds. • Example: images of objects from multiple classes seen from multiple viewpoints.
Visualization of classes in MNIST data t-SNE ISOMAP
Dimensionality reduction resources “Dimensionality reduction: a comparative review” (mostly nonlinear methods) MATLAB toolbox for dimensionality reduction