Guiding Cognitive Processing
Guiding Cognitive Processing. EDU 221. Guiding Cognitive Processing. Group Presentation Reflections due for 7 & 8 Quiz #2 (Tuesday, Nov. 16 th ) – Problem-based What makes an outstanding response? Referring to our text, study results, outside info Bring your Bluebooks…

Guiding Cognitive Processing
E N D
Presentation Transcript
Guiding Cognitive Processing EDU 221
Guiding Cognitive Processing • Group Presentation Reflections due for 7 & 8 • Quiz #2 (Tuesday, Nov. 16th) – Problem-based • What makes an outstanding response? Referring to our text, study results, outside info • Bring your Bluebooks… • Chapter 10 Group Presentation • Effective Teaching cont. • No Child Left Behind
Professional Knowledge and Skills • Subject Matter Competence • Instructional Strategies • Planning Skills & Goal Setting • Classroom Management Skills • Communication Skills • Cultural Awareness • Technology Skills
Classroom Management Skills • Clear expectations • Structured Learning Environment • Clear Limits • Consistent Consequences • Warmth and Caring • The Authoritative Teacher
Communication Skills • Clear organized presentations • Communicating with parents
Cultural Awareness • Regional Differences • Montana- Native Populations • Reason for the NAMS requirement • OPI Website- Indian Ed Training
Technology Skills • Use with students • Parent communication
Motivation and Commitment • Emotional Intelligence • Motivational Skills • Empathy
The Achievement Gap • A “gap” (difference) in academic achievement between minority and disadvantaged students and middle/upper class white students in the United States • To include students: • from economically disadvantaged families • from minority ethnic and racial groups- blacks, Hispanics, and native populations • with limited English proficiency • with disabilities (i.e., special populations)
The Achievement Gap- Statistics • The average 8th-grade minority student scores at about the same level as the average white 4th- grader. • The gap between white students and black and Latino students on high school exit exams averages 20-30 points in most states. • About 1 in 6 Native American 8th- grader is proficient in reading and 1 in 7 is proficient in math. • Socio-economic status remains the most powerful single influence on students’ educational outcomes. • Most of the social class differences in average academic potential exists by the time children are 3 years old. • 13.6% of all children 6-17 in U.S. receive SPED related services • 50% of students who test out of Special Education in a given year re-qualify for services the following year.
Montana Statistics Achievement gaps in NAEP results • American Indian 8th grade students 3x likely to score Below Basic in Reading. • Free and Reduced Lunch 2x likely to Score Below Basic • 52% American Indian scored Below Basic in MTH compared to 16% for white students • Low income students 3x likely to score Below Basic in MTH • 34% American Indian HS grads completed ACT core, as compared to 40% Hispanic, 50% white students • ACT composite for American Indian students 18.6; 23.6 for white students
School Based Reasons forThe Achievement Gap Schools with many low-income and minority students generally have: Fewer instructional resources Fewer and lower quality books Fewer qualified and experienced teachers Fewer course offerings Significantly larger class sizes Tracking systems that segregate these students within school
Intent of NCLB: No Child Left Behind is designed to change the culture of America's schools by closing the achievement gap, offering more flexibility, giving parents more options, and teaching students based on what works.
History • Elementary and Secondary Education Act- 1965 • Education Consolidation and Improvement Act of 1981 • Improving America's Schools Act of 1994 • No Child Left Behind Act of 2001
NCLB Goals • ALL students will attain proficiency or betterin reading and mathematics by 2013-2014 • ALL limited English students will becomeproficient in English • ALL teachers will be highly qualifiedby 2005-2006 • ALL students will be educated in safe,drug-free environments • ALL students will graduate from high school
Testing Requirements • Annual reading and math assessments atgrades 3-8 • Science assessments • Once in grades 3-5, 6-9, and 10-12 • Limited English students must be assessed annually for English language proficiency
Accountability • Test data are used to measure performance of each school to determine the school’s Adequate Yearly Progress (AYP). • Every state sets their own standards by which AYP will be measured. • States must use student performance on annual assessments in reading and math as the primary measures of AYP. The starting point is based on the 2001-2002 achievement data.
AYP (Adequate Yearly Progress) To achieve AYP, a school must meet or exceed Annual Measurable Objectives (AMOs) schoolwide and for each student subgroup: • economically disadvantaged • major ethnic and racial groups • students with disabilities • English language learners Note: Science testing will not count toward AYP
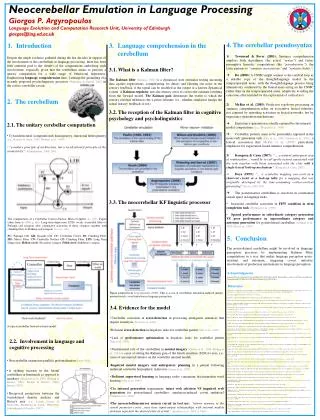
Adequate Yearly Progress Example 100% 100% Target 2013-2014 Students in School 95% 90% 85% 80% 75% 70% 65% 40% Baseline Target 2001-2002 60% 55% 50% 45% 40% 2001 2002 2004 2005 2006 2007 2008 2009 2010 2011 2013 2014
Continual Achievement: • States will determine annual objectives for progress • All subgroups (economically disadvantaged, major ethnic and racial groups, students with disabilities, and English language learners)must meet annual objectives for progress • 95% of all students and all subgroups of students must be included in the assessment • School may calculate 95% participation rate in tests over 2-3 years in determining this factor in the AYP • All subgroups must meet 100% proficiency by 2013-14
Schools that don’t meet AYP • If one subgroup of students fails to meet the school’s AYP targets for two years in a row, the school is tagged as in need of improvement. • Continued “need of improvement” will result in implementation of specific consequences • Each consecutive year, correctiveactions become more intensive
First Year of Remediation School Improvement Status-(Year 3 – After two consecutive years of not making AYP): • Technical assistance • Must provide public school choice • Supplemental Services (tutoring) • Two year School Improvement Plan • 10% of Title I funds must be allocatedfor professional development
2nd Year of Remediation (Year 4 – After three consecutive years of not making AYP)Continue actions from previous years ofschool improvement • Districts must take at least one of the following actions: • Replace relevant school staff • Implement a new curriculum and provideprofessional development • Significantly decrease management authority • Appoint outside expert to advise on schoolimprovement plan • Extend school year or school day • Restructure internal organization of school
3rd Year of Remediation (Year 5- after four consecutive years of not making AYP)Restructuring: • Continue activities from school improvement andcorrective action • Districts must take at least one of thefollowing actions: • Reopen school as a charter school • Replace all or most of relevant school staff • Contract with outside entity to operate school • State takeover • Any other major restructuring of school’s governancethat makes fundamental reform
Schools that do make AYP • No Child Left Behind requires states to provide academic achievement awards to schools that close achievement gaps between groups of students or that exceed academic achievement goals. • States may financially reward teachers in schools that receive academic achievement awards. • States must designate as distinguished schools those that have made the greatest gains in closing the achievement gap or in exceeding achievement goals.
Highly Qualified Teachers • All students will be taught by highly qualified teachers in core academic areas • English Economics • Reading/Language Arts Civics/Government • Mathematics Arts • Science History • Foreign languages Geography
Scientifically Based Research • All programs funded by NCLB must be grounded in scientifically based research. • Characteristics of scientific research-based studies: • Uses scientific method • Has been replicated • Can be generalized to larger population • Meets rigorous standards • Other studies/programs point to same conclusion
Doesn’t NCLB force teachers to teach to the test? Curriculum based on state standards should be taught in the classroom. If teachers cover subject matter required by the standards and teach it well, then students will master the material on which they will be tested--and probably much more. In that case, students will need no special test preparation in order to do well.
Where’s the money?? • 29% increase in total Federal education funding (from $42.2 billion in 2001 to $54.4 billion in 2007); • 33% increase in total K-12 funding (from $27.3 billion in 2001 to $36.3 billion in 2007); • 40.4% increase in total NCLB funding (from $17.4 billion in 2001 to $24.4 billion in 2007); • 45% increase in Title I (from $8.8 billion in 2001 to $12.7 billion in 2007); • 68.5% increase for Special Education (IDEA) grants to states (from $6.34 billion in 2001 to $10.7 billion in 2007); and • Quadrupled funding for reading (from $286 million in 2001 to $1.2 billion in 2007) (a 300% increase).
Is NCLB working? Based on national data from July 2005: • America's nine-year-olds posted the best scores in reading (since 1971) and math (since 1973) in the history of the report. America's 13-year-olds earned the highest math scores the test ever recorded. • Reading and math scores for African American and Hispanic nine-year-olds reached an all-time high. • Math scores for African American and Hispanic 13-year-olds reached an all-time high.
Controversy • Not all agree with the previous statistics • States adjusting standards- differences by state • Growth ignored- need to revise model • Drop-out rate increasing • Students appear less prepared for college
Blueprint on Reform • March 13, 2010- submitted to Congress • http://www2.ed.gov/policy/elsec/leg/blueprint/blueprint.pdf • Proposed Changes • Name to revert back to ESEA • Adopting National “core” standards • Graduate college- or career-ready by 2020 • “Race to the Top” rewards for successful reform • Expand Charter Schools • Allow differentiate compensation for educators who are effective in increasing achievement • Required to “equalize” resources