Download
1 / 31
310 likes | 398 Views
This study explores pediatric pedestrian injuries in NYC, emphasizing the role of vehicle types and the Safe Routes to School program. It delves into injury rates, risk factors, and potential interventions for improved safety. The research highlights the decline in pedestrian injuries, associations with vehicle types, and the importance of head injuries. Suggestions include traffic calming measures and the Safe Routes to School initiative for safer pedestrian environments. The study also discusses the impact of age, gender, and vehicle factors on injury outcomes.

E N D
Pediatric Pedestrian Injuries in NYC and Safe Routes to School Charles DiMaggio, PhD, MPH, PA-C Associate ProfessorDepartments of Anesthesiology and Epidemiology Research Director Center for Injury Epidemiology and Control Columbia University, NY
Acknowledgements • Centers for Disease Control and Prevention 1 R21 CE001816 and 1 R49 CE002096 • New York City Department of Transportation • Guohua Li, Peter Meunnig, QixuanChen, Maureen Durkin, Lynne Richardson
Some Conclusions • Traffic Calming Works • Evaluation Important • Kids can still be kids and be safe
Overview • Pediatric Pedestrian Injury • NYC Experience in late 1990s and role of vehicles type • Safe Routes to School Program in NYC
Pediatric Pedestrian Injury in the US • 25% of pediatric mvc deaths are pedestrian (vs. 5-10% adults) • leading cause of TBI in kids • about half all injury-related pediatric hospital admissions each year • 579,621 ED visits 1- 19 y/o 2001-2010 • 8,651 deaths • 23% psych sequellae • Decreased activity, obesity
Pedestrian Injury in NYC • 1572 total fatalities 2004-2008 (~300 per year)* • 35% decrease since 2001 • 3.5 fatalities per 10,000 population (lower than Copenhagen) • 168,000 total injuries over recent 10 years, or ~ 16,800 per year * New York City Pedestrian Safety Study and Action Plan, 2010
Pediatric Pedestrian Risk in the 1990s • NYC DOT Compiled NYPD Police Crash Reports • MV104AN • 700,000 MVCs NYC 1991-1997; 1.5 million vehicles; 900,000 injured; 100,000 pedestrians • 27,377 crashes involving ages 5-19 • 149 Fatalities (54 per 10,000) • 18,117 (66%) vehicle information (VIN) • Analysis • 5-9, 10-14, 15-19 • Frequencies, Odds Ratios Association Fatality • Logistic regression LTV (exposure) fatality (outcome) • Covariates: driver age, driver gender, vehicle weight
Pediatric Pedestrian Risk in the 1990s • Yearly Injury Rate 1991-1997, 5-19 y/o’s: 246/100,000 • Males, 9 y/o, weekdays, summer • Younger than 10 years: • 22.6% increase population • 41.5% decrease injury rate • Stable CFR (<1%)
The Role of Vehicle Type • Association with Fatality (Univariate) • Driver age < 25: OR = 2.0 (95% CI 1.2, 3.1) • Male driver : OR = 2.2 (95% CI 1.1, 4.3) • Head Injury: OR = 2.5 (95% CI 1.6, 3.7) • Light Trucks and Vans* • 5-19 y/o OR - 2.5 (95% CI 1.6, 3.8) • 5-9 y/o OR - 4.2 (95% CI 1.9, 9.5) • 10-14 y/o - 1.0 (0.3, 2.9) • 15-19 y/o - 2.5 (1.0, 6.5) * Logistic Regression Controlling for Driver Age and Gender, Vehicle Weight *Regression model controlling for driver age, gender, road surface condition, vehicle weight, head injury
Interaction TBI with LTV? • Younger kids had more head injuries • OR for 5-9 y/o = 1.6 (95% CI 1.5, 1.7) • But this association did not differ by vehicle type • LTV OR =1.7 (1.4,2.0) Car OR=1.6 (1.5,1.7) • Head injuries associated with fatality for all kids: OR 5-19 y/o=2.3 (95% CI 1.6,3.4) • But as likely to result in fatality in any age • 5-9 y/o OR = 2.5 (1.3, 4.9), 10-19 y/o OR=2.3 (1.4, 3.7) • As likely to result in fatality in both body types: • LTV OR=2.5 (1.2,4.9) Cars OR=2.4 (1.4,3.9)
LTVs more likely to strike younger children? • Theoretically Plausible • carriage height + pedestrian height = visual obstruction • Not Supported by Data • Association LTV + Age: 5-9 y/o OR=1.2 (1.1, 1.4), 10-19 y/o OR=1.1 (1.0, 1.3) • Physics • Speed • F=mv2/2 • child hit by vehicle at 30 mph 50% survival • 18 mph, 90% survival
Some Conclusions • Declines in pediatric pedestrian injury in NYC • implications for activity? • Ian Roberts “Why have child pedestrian injury rates fallen?”, BMJ, 1993 • LTVsare associated with fatal pediatric pedestrian injuries • Association Mostly due to Youngest Pedestrians • Measurement Error • Head Injury
Next steps? • Large routinely collected administrative databases are useful epidemiologic tools • advances in computing • advances in analysis • Possible Interventions: ”New York Model” (Susan Standfast, MD) • engineering, enforcement, education • evaluation, environment, EMS…
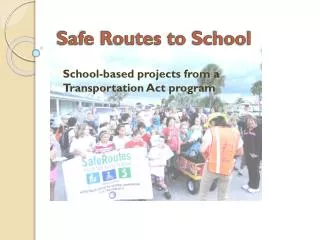
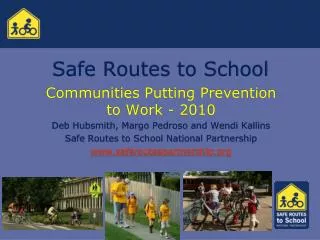
Safe Routes to School • 2005 US DOT legislation $612 million • by 2012, total about $1.12 billion • 10,000 of nation’s 100,000 schools • get kids walking / biking (safely) to school • 130 of 2,000 NYC schools • Traffic and pedestrian signals, exclusive pedestrian crossing times, speed bumps, speed boards, sidewalk extensions; ~ 700 ft. buffer
Traffic Calming • reduce pedestrian injuries by slowing traffic, ceding rights to pedestrians, and providing disincentives for driving • road narrowings, • new traffic and pedestrian signals, • timed crossings that allow pedestrians to cross before cars, • speed bumps, • speed boards (radar-equipped digital signs that tell drivers how fast they are moving), • high visibility crosswalks • new parking regulations
NYC SRTS Evaluation Program • Data and Analysis • 186,000 geocoded pedestrian crashes 2001-2010 • Geocoded school centroids • Census tract injury counts • Mon-Fri, 7AM-9AM or 2PM-4PM (excluding Summer, Holidays) • Compare SRTS census tracts vs non-SRTS census tracts pre and post program implementation (2008)
Results • 44% decrease (95% CI 17%,65%) in SRTS census tracts following program implementation • 0% change (95% CI -8%, 8%) in non-SRTS census tracts following program implementation
Graphical Assessment School-Aged Pedestrian Crashes per 10,000 Population During Travel To-From School Hours, SRTS Intervention Census Tracts (Yes) vs. Non-Intervention Census Tracts (No), New York City 2001-2010
Changepoint Analysis most likely changepoint SRTS census tracts 2nd quarter 2008 (quarter 30.5, 95% Cr I 30, 31) non-SRTS census tracts largely unchanged
Difference in Differences Analysis log(t) = 0 + 1 Periodt + 2 SRTS + 3Periodt*SRTS + log(Populationt) • 44% risk reduction (95% CI 87% decrease, 130% increase) • compared to incomplete SRTS: 32% risk reduction (95% CI 74% decrease, 78% increase)
Cost Benefit / Effectiveness • Markov model long-term impacts SRTS on injury reduction • savings medical costs, disability, death • overall net societal benefit $230 million, 2,055 QALYs NYC • $9.2 million, 1,638 QALYs school-aged pedestrians • much of cost benefit from reduced school-bus use Muennig P, Epstein M, Li G and DiMaggio C
Next Steps • New York City • Spatial Temporal Analysis • Transportation Alternatives – Speed Cameras • Texas, New York State, California • County-Level Data • Individual States and Multilevel Modeling • National Analysis • US Department of Transportation SDS • Individual States • Arkansas, Iowa, Kansas, Kentucky, Maryland, Michigan, Minnesota, Missouri, Montana, Nebraska, New Mexico, Ohio, Pennsylvania, South Carolina, Virginia, Washington, Wyoming,
Some Conclusions about SRTS • Traffic Calming Works • expensive, but we can rationally and effectively use public resources to address public health and safety • education and enforcement still important • Evaluation Important • MAP-21 removes SRTS as stand-alone program • difficult to tease out effects of any single program • 1500 pedestrian signals, re-engineered 60 miles of streets, 20 MPH pedestrian safety zones • NYC experience unique? • Kids can still be kids and be safe