Download
1 / 31
310 likes | 462 Views
IAB PwC ONLINE ADSPEND STUDY H1 2011. Suzanne McElligott Chief Executive, IAB Ireland November 11th, 2011. In association with PwC. IAB FULL MEMBERS. IAB MEMBERS. Agenda. Introduction Study Methodology Market Background Online Adspend Results Looking ahead… Questions. 1. INTRODUCTION.

E N D
IAB PwC ONLINE ADSPEND STUDY H1 2011 Suzanne McElligott Chief Executive, IAB Ireland November 11th, 2011 In association with PwC
Agenda Introduction Study Methodology Market Background Online Adspend Results Looking ahead… Questions
1. INTRODUCTION • Census of all major Irish online media owners • Information collected each half year • Analysis available by • Format • Industry category
2. STUDY METHODOLOGY • Internationally, IAB has been working with PwC since 1997 to survey the value of online adspend in Europe and North America. • In our study, 26 leading publishers participated, representing multiple websites. • 14 Sales houses and adnetworks also participated • All data was provided to PwC on a confidential basis
SURVEY PARTICIPANTS *estimates prepared, not participants
STUDY CONTENT • Total advertising revenue is reported on a gross actual basis (including agency commission) • The figures are drawn up on the basis of actual revenues submitted by the study participants • Both Google and Facebook do not break out their earnings from Irish advertisers. PwC created an independent estimate by extrapolating from spend data provided directly by a representative sample of their clients.
3. MARKET BACKGROUND Q2 2010 TO Q2 2011 GDP grew 2.3% GNP grew 1.1% Net Exports were the main contributor to annual growth Source: CSO: Quarterly National Accounts Quarter 2 2011
BROADBAND CONNECTION Q2 2011 Broadband – Fixed and Mobile continue to grow +8.3% Fixed Broadband increased by 8.3% between Q2 2010 and Q2 2011 Mobile Broadband increased by 14.8% between Q2 2010 and Q2 2011 ComReg Quarterly Key Data Report Q2 2011 (14 Sept 2011)
TIME SPENT ONLINE Time spent online 2hrs 44 minutes each day Time spent watching TV 2hrs 49 minutes each day Average time spent online now mirrors time spent watching TV Red C De-Coding Digital Trends 2011
SOCIAL MEDIA USAGE May 2011 1,937,000 Facebook members in Ireland Up from 627,000 in May 2009 64% of Irish Internet Users 42% of Irish Adults Source: Amárach The Smart Future May 2011 Irish online users are now spending 8 hours per week on social media (18-24’s 11 hours) Behaviourand Attitudes Bacardi Together Poll July 2011 *
MOBILE TRENDS Red C’s Digital Trends Study predicts Smart Phone penetration to grow to 55% of Internet users in 2012 • 34% of smart phone users surf the web on their smart phone when there’s a pc/laptop nearby ... every day 27% of smart phone users have clicked on an advertisement on their smart phone (whether online or in an app)* * Amárach The Smart Future May 2011
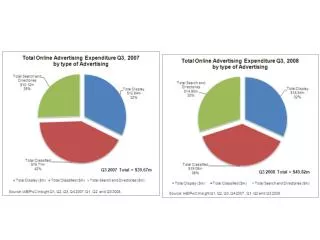
SPEND BY MEDIA TYPEH1 2011 v H1 2010 Adspend on other media types (not incl. online) is down 1.55% H1 2011 from H1 2010 Nielsen Jan to June 2011
4. IAB IRELAND PwC ONLINE ADSPEND H1 2011 GROSS ONLINE ADSPEND: € 64.9 M
ONLINE REVENUEH1 2011 vs H1 2010 +20.5% H1 2010: €53.9M H1 2011:€64.9M
ONLINE SHARE OF ADVERTISING SPEND Online has grown its share of total advertising spend from 11% H1 2010 to 13% H1 2011
DIGITAL MEDIA MIX H1 2011 Breakdown by advertising format based on figures provided 21% (12.7m)
DIGITAL MEDIA MIX H1 2010 Breakdown by advertising format based on figures provided 26% (€13.2m)
DISPLAY BREAKDOWNH1 2011 Breakdown of display advertising based on figures provided
DISPLAY BREAKDOWN H1 2010 Breakdown of advertising format based on figures provided – display
INDUSTRY CATEGORIES - Display Top performers in Display : • Telco (12%) • FMCG (12%) • Entertainment and Media (12%) Top performers : • Automobile (22%) • Recruitment/Property (19%)
H1 2010 DISPLAY & CLASSIFIED BREAKDOWN BY INDUSTRY CATEGORY Breakdown by industry category *excludes search Note: ‘Other’ dominated by charity
IRISH MOBILE ADVERTISING MARKET • Based on ( information provided by) discussions with a number of industry representatives, the value of the Irish mobile display advertising industry in H1 2011 is estimated at: • Mobile advertising is believed to be growing at a rate of 150%+ per annum. € 1.6 M
5. LOOKING AHEAD Smart phone penetration to grow to 55% of online users in 2012 (Red C Digital Trends Study)
Next IAB PwC Study - Full Year 2011- APRIL 2012
OUR THANKS TO • All our participants • PwC Date for your diary IAB Connect February 16th 2012
6. QUESTIONS ? • For Further information: • info@iabireland.ie