Download
1 / 59
590 likes | 745 Views
Observation of Single Top Quark Production. Cecilia E. Gerber University of Illinois at Chicago March 18, 2009. Outline. Introduction Top Quark Single Top observation Results Conclusions. Why bother with HEP?. What is the World Made of ? What are the building blocks of matter?

E N D
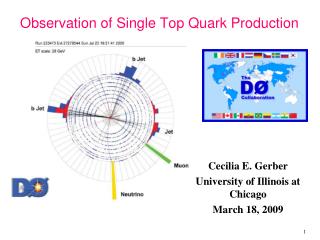
Observation of Single Top Quark Production Cecilia E. Gerber University of Illinois at Chicago March 18, 2009
Outline • Introduction • Top Quark • Single Top observation • Results • Conclusions
Why bother with HEP? • What is the World Made of ? • What are the building blocks of matter? • How do they interact with each other? • Connection with Cosmology?
What is the World Made of? Anaximenes of Miletus (6BC) ELEMENTARY CONSTITUENTS INTERACTIONS “All forms of Matter are obtained from rarifying Air” Water Fire • Simple: few constituents and interactions. • Wrong: No experimental confirmation. Earth Air
e e u d c s t b g W+ Z0 W- g What is the World Made of? Standard Model (~1970 AC) ELEMENTARY CONSTITUENTS Strong 1 Electromagnetic 10-2 INTERACTIONS Higgs Weak 10-6 H Gravity 10-40
Rutherford Scattering Alpha particles were allowed to strike a thin gold foil. Surprisingly, alpha particles were found at large deflection angles and ~1 in 8000 were even found to be back-scattered. This experiment showed that the positive matter in atoms was concentrated in an incredibly small volume and gave birth to the idea of the nuclear atom.
Chicago Booster CDF DØ Tevatron p source Main Injector DØ CDF The Fermilab Tevatron Accelerator p anti-p collider: 1992-96 Run 1: 100pb-1, 1.8TeV 2001-ongoing Run 2: >5 fb-1, 1.96TeV Next in line: CERN LHC (pp) 14TeV
UnderlyingEvent g q u u q d u d u Hard Scatter How do we do research in HEP? • By taking these speeding subatomic particles and smashing them together, we can see what comes flying out. • At the Tevatron, ~1,000,000/sec a proton and an anti-proton cross each other. Only ~1/sec a Hard Scatter occurs • We are probing matter at the 10-17 cm level!
Proton-anti Proton Collision Small x, products boosted along beam direction • Large x, can create massive objects that decay to secondaries with large momentum component transverse to the beam For every proton there is a probability that a single quark (or gluon) carries a fraction “x” of the proton momentum Good way of telling that a hard collision occurred.
Now (13.7 billion years) Stars form (1 billion years) Atoms form (380,000 years) Nuclei form (180 seconds) Nucleons form (10-10 seconds) Quarks differentiate (10-34 seconds?) ??? (Before that)
Fermilab 4x10-12 seconds Now (13.7 billion years) Stars form (1 billion years) Atoms form (380,000 years) Nuclei form (180 seconds) Nucleons form (10-10 seconds) Quarks differentiate (10-34 seconds?) ??? (Before that)
LHC 10-25 seconds Now (13.7 billion years) Stars form (1 billion years) Atoms form (380,000 years) Nuclei form (180 seconds) Nucleons form (10-10 seconds) Quarks differentiate (10-34 seconds?) ??? (Before that)
neutrinos A generic HEP detector
DØ CDF The D0 and CDF detectors at Fermilab
Single Top Working Group E. Aguilo, J. Benitez, E. Boos, R. Brock. V. Bunichev, Y. Coadou, L. Dudko, Y. Enari, T.Gadford. C. Gerber, D. Gillberg. I. Hall, A. Heinson, U. Heintz, S. Jabeen, S. Jain, L. Li, Z. Liu, M. Narain, D. O’Neil, G. Otero, M. Padilla, M. Pangilinan. M. Perfilov, H. Prosper, R. Schwienhorst, E. Shabalina, A. Tanasijczuk Color code: Student Post Doc Group Leader
Predicted by the SM and discovered in 1995 by CDF and DØ mt=172.4 ± 1.2 GeV Couples strongly to the Higgs may help identify the mechanism of mass generation may serve as a window to new physics that might couple preferentially to top Why Study the Top Quark? • Successful Tevatron top quark program • High precision measurements for the top quark mass, top pair production cross section and decay properties • Some basic quantities still unmeasured: spin, width, lifetime • Single top quark production predicted by the SM, had not been observed till now
SM Constraints on the Higgs Light Higgs preferred by the SM with latest top and W mass Plots from LEP/TEV EW working group LCWS08 C. Gerber (UIC)
Top-anti Top quark production Top anti-Top pair production (via strong interaction) Run1(1.8TeV)Run2(2TeV)LHC(14TeV) 90%85% 5% 10%15% 95% 5.4 pb7.9 pb 800 pb x-sec(pb)
Single Top quark production Single Top production (via electroweak interaction) (Drell-Yan) (W-gluon fusion) Run1(1.8TeV)Run2(2TEV)LHC(14TeV) 0.7 pb0.9 pb 10 pb 1.7 pb2.4 pb 250 pb x-sec(pb)
Top quark events are rare! • Top production is a rare process: about one collision in every 11010 produces a Top-anti Top quark pair. • Small cross sections require high luminosity, and the ability to detect and filter out • Top-anti Top events from a large number of other processes with the same final states (backgrounds)
Top-quark decay • ~100% of the time, a top quark decays into a bottom quark and a W boson. • The W boson can decay into two quarks or into a charged lepton and a neutrino. • A Top-anti Top event should therefore have either: • 6 quarks • 4 quarks, 1 charged lepton and 1 neutrino • 2 quarks, 2 charged leptons and 2 neutrinos In all cases, 2 b-quarks are present in the event
But important for Higgs observation • Same final state as WH • Backgrounds are the same • Test of techniques to extract small signal from a large background
Evidence for Single Top Production Status as of March 3, 2009 Observed significance is a measure of how likely it is to measure the cross section in the absence of signal
DØ Evidence paper PRL “Editor’s Suggestion” 110 SPIRES citations Culmination of a Long History DØ Search: PRD 63, 031101 (2000) Search: PLB 517, 282 (2001) Search: PLB 622, 265 (2005) W’: PLB 641, 423 (2006) Search: PRD 75, 092007 (2007) Evidence: PRL 98, 181802 (2007) FCNC: PRL 99, 191802 (2007) W’: PRL 100, 211802 (2007) Evidence: PRD 78, 012005 (2008) Wtb: PRL 101, 221801 (2008) Wtb: PRL 102, 092002 (2009) H+: (PRL) arXiv:0807.0859 Observation:(PRL) arXiv:0903.0850 CDF Search: PRD 65, 091102 (2002) W’ PRL 90, 081802 (2003) Search: PRD 69, 052003 (2004) Search: PRD 71, 012005 (2005) Evidence: PRL 101, 252001 (2008) FCNC: (PRL) arXiv:0812.3400 W’: (PRL) arXiv:0902.3276 Observation:(PRL) arXiv:0903.0885 DØ observation paper Submitted to PRL March 4, 2009
Dataset • DØ has >5 fb–1 on tape DØ Layer Zero • This analysis uses 2.3 fb–1 of data collected from 2002 to 2007 • Full Run IIa dataset, 1.1 fb-1 (20% increase w.r.t. 2006 analysis) • Run IIb dataset, 1.2 fb-1
/ ET Event Selection FINAL STATE CONTAINS: • One high-pT isolated electron or muon • Large missing transverse energy • At least 2 jets • Analysis is performed in 24 channels: • Run IIa or Run IIb • e or mu • 2, 3 or 4 jets • 1 or 2 b-tags
W+jets and multijet normalized to data using three sensitive variables: pT(l), , MT(W) Uncertainty obtained from max. difference with 1-variable result 30 to 54% for multijet, 1.8 to 3.9% for W’s / ET Background Normalization S:B = 1:259 DØ
B Decay Products Flight Length ~ few mm Collision Decay Vertex Impact Parameter Identifying b-Jets DØ Silicon Microstrip Tracker
DØ uses a neural network algorithm with seven input variables based on impact parameter and reconstructed vertex Two operating points used in analysis: TIGHT (eb = 40%, el = 0.4%) LOOSE (eb = 50%, el = 1.5%) Define two exclusive samples EqOneTag: 1T, no L EqTwoTag: 2L b-Jet Identification S:B = 1:21 in 1Tag S:B = 1:15 in 2Tag DØ DØ
Good data/simulation agreement EVENT KINEMATICS OBJECT KINEMATICS ANGULAR CORRELATIONS DØ DØ DØ JET RECONSTRUCTION TOP QUARK RECONSTRUCTION DØ DØ
/ / ET ET Also in background-dominated regions • Selected to test background model in regions dominated by one type of background: W+jets or Top Pairs Top Pairs 4 jets, 1 or 2 b-tagged jets HT(l, ,allJets) > 300 GeV W + JETS 2 jets, 1 b-tagged jet HT(l, ,allJets) < 175 GeV DØ DØ
Analysis Strategy • Maximize number of single top events in the sample • Background model gives good representation of data in each of the 24 independent analysis channel • uncertainty on the background is larger than the signal • Calculate discriminant functions that separate signal from background • Boosted Decision Trees (BDT) • Bayesian Neural Networks (BNN) • Matrix Elements (ME) • Check discriminant performance using data control samples • Use ensembles of pseudo-data to test validity of methods • Calculate production rate and estimate significance
Multivariate Analyses Boosted Decision Trees (BDT) • Recover events that fail criteria in cut-based analysis • Boosting averages the results over many trees, improving the performance • Bayesian Neural Network (BNN) • NN train on signal and background, producing one output discriminant • Bayesian NN average over many networks, improving the performance Use common Object and Event Kinematics, Angular Correlations, Jet Reconstruction and Top Quark Reconstruction variables • Matrix Element (ME) • Use Feynman diagrams to compute an event probability density for signal and background hypotheses • Split the sample in high and low HT
Cross Check Samples and Linearity BDT DØ DØ DØ DØ BNN ME DØ DØ
Statistical Analysis Before looking at the data, we can calculate: • “expected p-value”: fraction of the ensemble of zero-signal pseudo-datasets that give a cross section at least as large as the SM value. With the data, we can calculate: • “measured cross section” • “measured p-value”: fraction of the ensemble of zero-signal pseudo-datasets that give a cross section at least as large as the measured value • For a Gaussian distribution, convert p-value to give “measured significance” • 3σ= “evidence”, 5σ= “observation”,
Single Top Production Rate • Cross Sections are measured by building a Bayesian posterior probability density For each analysis, the single top cross section is given by the position of the posterior density peak, with 68% asymmetric interval as uncertainty
Combination of Results • Even though all MVA analyses use the same data, they are not 100% correlated • BNN&BDT are 75% correlated with each other, 60% with ME • We use a BNN to combine the three methods. The BNN takes as input variables the output discriminants of the individual methods • Expected sensitivity for the BNN Combination: 4.5 CROSS CHECK SAMPLES AND LINEARITY
Combined Results (mt=170GeV) Measured Significance 5.03σ
Distributions for BNNComb > 0.9 EVENT KINEMATICS OBJECT KINEMATICS ANGULAR CORRELATIONS DØ DØ DØ JET RECONSTRUCTION TOP QUARK RECONSTRUCTION SINGLE TOP FINAL STATE DØ DØ DØ