Download
1 / 30
300 likes | 444 Views
地中海寡營養鹽地區, nano 級 (2~20μm) 微細鞭毛蟲攝食自營性和異營性 pico 級 (0.2~2μm) 浮游生物. Reporter: Wang ciou-jyu. Objective. Vertical and spatial distribution of the autotrophic and heterotrophic prokaryotes assess the relative importance of nanoflagellate grazing on their population in the Mediterranean.

E N D
地中海寡營養鹽地區,nano級(2~20μm)微細鞭毛蟲攝食自營性和異營性pico級(0.2~2μm)浮游生物地中海寡營養鹽地區,nano級(2~20μm)微細鞭毛蟲攝食自營性和異營性pico級(0.2~2μm)浮游生物 Reporter: Wang ciou-jyu
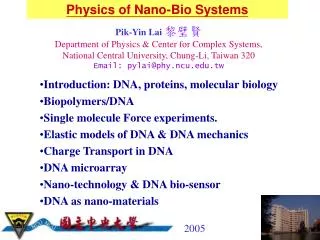
Objective • Vertical and spatial distribution of the autotrophic and heterotrophic prokaryotes • assess the relative importance of nanoflagellate grazing on their population in the Mediterranean.
0.2~2μm • Heterotrophic bacteria • Synechococcus • Prochlorococcus 20~200μm Ex: ciliate 2~20μm 1. Heterotrophic nanoflagellates 2. pigment nanoflagellates 1983年 Azam microbial loop
地中海是一個高度貧營養地區,所以此地區的生產率和攝食率均偏低地中海是一個高度貧營養地區,所以此地區的生產率和攝食率均偏低 • 地中海有一個明顯的貧營養階層 • Nutrient depletion : 遞增 • productivity : 遞減 • Chlorophyll concentration : 遞減 西 東
Concerning consumption ofcyanobacteria by nanoflagellates, the few existing field studies are based on community approaches such as size fractionation , dilution , specific inhibitors , disappearance rates of prey analogues (Landry et al.,1984;Kudoh et al., 1990; Caron et al., 1991; Liu et al., 1995; Reckermann and Veldhuis,1997) • A single study exists based on direct estimates from food vacuole content analysis of nature marine heterotrophic nanoflagellate populations (Dolan and Simek,1999).
採樣時間: 1999年6/4 ~7/2 採樣深度 : 0-200m
Nanoplankton,picoplankton population and biomass estimates 1.螢光顯微鏡 Bac Syn(FDC) 記數 NF ( NF分三種大小: <3μm , 3-5μm, 5-10μm ) 分HF , PF 2.Flow cytometry Syn , Prochlorococcus 流式細胞儀進行分析 3.Conversion to biomass
Bacterial production 3H-labell leucine BP • Heterotrophic bacterial production Bac. growth rate in situ= BB • Heterotrophic bacterial grazing measurement Station: 2 (120m) 、4(75m) 、6(75m) 、8(75m) 、9 (60m) Maximum fluorescence depth
<20μm FLB ingestion rate Bac. Ingestion rate 4h 20ml a. Analysis of ingested FLB in food vacuoes b. Disappearance rate of FLB in long-term incubations(42h) 各取10ml 算bac , FLB 各取30ml算HF 42h <100μm <0.8μm <20μm FLB disappearance rate
no predator predator c. Changes in bacteria in 0.8μm and <20μm(HF present) screened sea water (42h) Ingestion rate (g) μnet= K μnet= K - g d. The consumption of bacterial by HF Clearance rate =105×body volume h-1 (Fenchel, 1982b) ml bac bac × = f h ml f h
Synchoccus consumption by HNF • 使用螢光顯微鏡觀察SYN in food vacuoles • 由於表層的SYN色素微弱,所以看深度 50-120m • Ingestion rate
60m 120m 葉綠素最大值︰東邊到西邊 由深到淺 (Turley et al.,2000)
>105 50~75m ▲75~100m 102~104 Pnf : 7000 cells/ml 75m 1500 cells/ml HF: 3200 cells/ml 1300 cells/ml
Oligotrophic area: Pico- and nanoplankton abundance and biomass dominance of heterotrophs (Gasol et al.,1997; Sanders et al.,2000) heterotrophs>autotrophs 75 13 現場細菌成長率較快
Clearance rate =105× body volume h-1 2倍 ∵有30%的HF(>3μm)會攝食比細菌大的生物 • 45-87%
<20μm <100 μm FLB decrease 16-30% 18-34% 90% of bacterial consumption was due to grazers <20μm PN沒有攝食FLB similar result: other marine (Caron et al.,1991); freshwater system (Simek et al.,1997) 所以不排除此研究的PN有可能拒絕攝食P.diminuta FLB 90% of bac -> HNF
Few clearance rates of HF on natural synechococcus population are reported in the literature. • HN : 0.01~0.15 cells HN-1(mean ± SD, 0.06 ± 0.04) 0.5-45% (平均13%)
FDC : 2.6 ~ 40% St1:33%, St2:33%, St3:22% Other stations:7~17% HF seem to select against FDC Some other types of predators probably select for FDC, keeping the population under control. Other potential SYN sources of mortality : ciliates, phagotrophic phytoplagellates, viruses. But ciliate abundance (low): 4-350cells/l (Pitta et al.,2001) 地中海 Moderate consumption Ciliate grazing rates on syn. NF grazing rates on syn. : =10-100倍
5%of PN ingesting SYN • 地中海(Christaki et al.,1999b; Dolan and Simek, 1999): Few ingested synechococcus among PN, suggesting a minor role of phagotrophic phytoflagellates, in synechococcusconsumption in this region.
Prochlorococcus cells are ingested according to their standing stock.(Reckermann and Veldhuis,1997) • HN were unable to consume their cell production.
餌料 Clearance rate × = Ingestion rate ml 100倍 27%
Conclusion 90% Synechococcus Prochlorococcus bacteria HNF PNF 5% 27% carbon