GIS PET Data Update (hg19 Remapping, Submission and Analysis)
GIS PET Data Update (hg19 Remapping, Submission and Analysis). Genome Institute of Singapore June, 02, 2010. Update: hg19 Remapping and Submission status GIS PET Overview (RNA-PET, DNA-PET) PET Data Analysis: Replicate analyses (sequencing & biological)

GIS PET Data Update (hg19 Remapping, Submission and Analysis)
E N D
Presentation Transcript
GIS PET Data Update (hg19 Remapping, Submission and Analysis) Genome Institute of Singapore June, 02, 2010 • Update: hg19 Remapping and Submission status • GIS PET Overview (RNA-PET, DNA-PET) • PET Data Analysis: • Replicate analyses (sequencing & biological) • PET on Gencode Annotation Results
hg19 Remapping and Submission Status • RNA-PET (27-27bp): 8 library datasets completed and submitted; 1 • library running now and to be submitted by tomorrow (June, 03) • RNA-PET (18-16bp): 11 library datasets running in • parallel now, expected submission date: June, 05 • DNA-PET (27-27bp): 6 library datasets running in parallel now, • expected submission date: June, 04 • RNA-Seq (SOLiD): 4 library datasets running in parallel now, • expected submission date: June, 05
RNA-PET (27-27bp tags) Template Sequencing and Mapping Solexa PE Sequencing • 36bp read = 27bp tag + 9bp linker sequences • Identify 3’ signature sequence for PET orientation • Uniquely-mapped PETs for future analysis
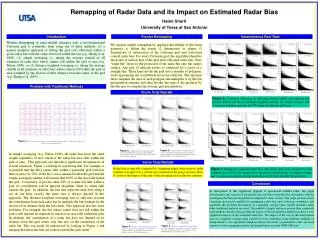
Library Noramlization: Gene expression level of each library is normalized by individual lib’s cPET counts/1,000,000 Same Library Different Runs NHEK cytosol(R= 0.9919463) NHEK nucleus (R= 0.9955129) HumanESCell(R=0.9991733) K562 cytosol(R=0.9882766)
K562 Cytosol Different Batch • R=0.8784952
Two Classes of Uniquely Mapped PETs • Concordant PETs (~80-90%): • Mapped on the same chromosome AND • Mapped on the same strand AND • Mapped in the same orientation • Discordant PETs (~10-20%): • Mapped on the different chromosomes OR • Mapped on the different strand OR • Mapped in the wrong orientation (e.g., 3’5’) • Only Concordant PETs analyzed for visualization
RNA-PET (27/27bp) Clustering 200bp -extension window 200bp -extension window clusters PET clustering Singletone filter out Singletone filter out 3’ 5’ Known transcript Isoform Unique mapped PETs and clusters Cluster 1-count: 5 Cluster 2-count: 6
RNA-PET (27-27bp) Visualization Example PET Mapped on 3’ PAS PET Mapped on 5’ TSS Lib & PET ID PET cluster counts: Sample-1 3 RNA-PET Sample 2 32 RNA-PET UCSC Reference genome 8
Annotation of RNA-PET clusters to Gencode Transcripts • Direct matching: Both 5’ and 3’ within their specific window Gencode Gene A RNA-PET Clusters ? ?
Statistics Approach: Empirical Bayes Threshold Annotation of 5’ and 3’-tags to Genecode promotor region • Empirical Bayesmethod is used to select the thresholds. • Wavelet transform raw data into coefficients in frequency and time domain. • Selected thresholds used to screen out background noise. • Empirical Bayes selection of Wavelet threshold. • (IM Johnstone. 2005)
Illustrative Method Description Thresholding & Cutoff Setting Illustrative Raw Data Profile High counts background automatically set to Zeros noise background counts Interval of zero: at least two zero neighboring each other. Cutoff: two vertical green lines (x=-98,x=97). Vertical central red line (x=0).
Wavelet threshold detection method to define cutoff for RNA-PET annotation to Gencode TSS & PAS Gencode Gene A RNA-PET Clusters ? ?
Tag counts profile at 5’-TSS and 3’-PAS H1 ES cytosol (IHE001) 5’-TSS 3’-PAS Tag counts GM12878 cytosol(IHG024) 5’-TSS 3’-PAS 120 bp 50 bp 5’-TSS 3’-PAS
Number of Annotated Gencode Transcripts Validated in GIS datasets (hg19) • Direct matching: Both 5’ and 3’ within their specific window
GIS PET-Identified Novel Transcripts Isoforms for Gencode-Annotated Transcripts and Genes (hg19) Matched at 5’ TSS but novel at 3’ PAS Matched at 3’ PAS but novel at 5’ TSS Novel transcripts
RNA-PET Identified Novel Transcript Isoforms found in regions “Unannotated” by Gencode database All files (excel) are ready for delivery to ENCODE