Download
1 / 81
810 likes | 1.29k Views
?. PRINSIP DAN STRATEGI ELUSIDASI STRUKTUR 1D NMR. RCC LIPI. INTRODUCTION. Mass Spectrum : MW (M + ), Formulae, Fragmentation FT-IR : Functional group (-OH, -C=O, -COOR, Ar, -C=C-)

E N D
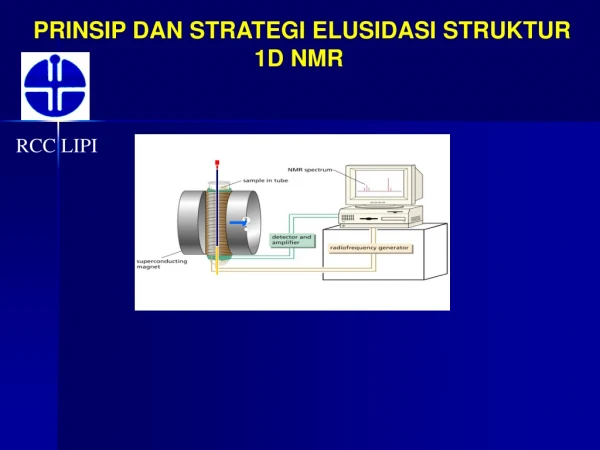
? PRINSIP DAN STRATEGI ELUSIDASI STRUKTUR 1D NMR RCC LIPI
INTRODUCTION • Mass Spectrum : MW (M+), Formulae, Fragmentation • FT-IR : Functional group (-OH, -C=O, -COOR, Ar, -C=C-) • Spectroscopy NMR :Chemical Shift information provides a clue about the electronic environment of the nucleus (spin-spin splitting between one nucleus) • Identification of species : genus/spesies, • Chemical constents : flavonoiid, xanthone, saponin, etc • Searching data base (Constituents), Chemical shift prediction (ChemDraw)
Substructural elements full connectivity 3D structure X-Ray UV IR MS NMR (+) + + + + + - - +? + + - - - + The NMR strategy and the NMR tools: - Number of protons, 1H chemical shifts, 1H-1H couplings ---> 1H spectrum - Number of magnetically nonequivalent carbons ---> 13C spectrum - 1H-13C direct correlation (one-bond) ---> HSCQ, (HETCOR) - 1H coupling network ---> COSY - 1H-X (X=13C, 15N, 19F, 31P, etc) long-range correlation ---> HMBC - stereochemistry, 3D structure ---> NOESY, ROESY
Introduction to Spectroscopy Instrumentally aided studies of the interaction between matter (sample being analyzed) and energy (any portion of the electromagnetic spectrum) Nuclear Magnetic Resonance NMR radio frequencies Hz or d Question: What actually happens to the sample during an analysis? {How do the sample and energy “interact”?}
Matter/Energy Interactions • What happens when a sample absorbs IR energy? stretching and bending of bonds (typically covalent bonds) Evibration increases momentarily IR -O-H -O —H (3500 cm-1) opposed to field • What happens when a sample absorbs Rf energy (radio frequencies)in an NMR experiment? nuclei previously aligned in a strong external magnetic field are “flipped” against the field Rf (100’s MHz) aligned with field {B0 = external magnetic field} B0
FT NMR 400 MHz, Varian Unity 5 mm Varian Probe (1H-19F)/(31P-15N)PFG
400 MHz NMR Spectrometer 400MHzAvanceSystem Unix computer electronic controls super- conducting magnet
400 MHz Superconducting Magnet • magnetic field strength • 9.4 Tesla (94,000 gauss) 400 MHz is the frequency used for proton detection in this field NMR sample tube and holder descend into center of magnet Keep metal (ferromagnetic) objects, pacemakers, and credit cards several feet away!
5 mm NMR sample tube upper level of NMR solution RFenergy NMR Sample Position(prior to release into probe) NMR sample positioned at top of probe Liquid Nitrogen -196°C (77.4K) Liquid Helium -269°C (4.2K) Superconducting magnets require continuous cooling.
Nuclei Unpaired Protons Unpaired Neutrons Net Spin I (MHz/T) Nat. Abundance (%) 1H 1 0 ½ 42.58 99.98 2H 1 1 1 6.54 0.016 31P 0 1 ½ 17.25 100 23Na 2 1 3/2 11.27 14N 1 1 1 3.08 99.63 13C 0 1 ½ 10.71 1.11 19F 0 1 ½ 40.08 100 Spin Number I of Nucleus and Abudances
b spin state Spin State Energy Differencesvs. Magnetic Field Strength randomly oriented nuclei (no magnetic field) E 200 MHz for 1H E 400 MHz for 1H Energy a spin state High Field NMR • increased sensitivity • increased resolution 0 4.7 9.4 Magnetic field strength, B0 (Tesla)
NMR Signals • The number of signals shows how many different kinds of protons are present. • The location of the signals shows how shielded or deshielded the proton is. • The intensity of the signal shows the number of protons of that type. • Signal splitting shows the number of protons on adjacent atoms. => Chapter 13
Interpretation of NMR Spectra Two signals split into multiple peaks having a ratio of areas of 2:3. 1H-NMR Data: 3 components “quartet” “triplet” 1. Chemical shift - each nonequivalent hydrogen gives a unique signal along the x-axis. 2. Spin-spin coupling - neighboring NMR active nuclei split each others signal. 3. Integration - peak areas are proportional to # of equivalent nuclei giving a signal.
Tetramethylsilane • TMS is added to the sample. • Since silicon is less electronegative than carbon, TMS protons are highly shielded. Signal defined as zero. • Organic protons absorb downfield (to the left) of the TMS signal. =>
Chemical shift Electrons surrounding a nucleus create a magnetic field (“shield”) which affects the size of the magnetic field seen at the nucleus
Penomena deshielded of electron cyrculation in double bond and Aromatic
Location of Signals • More electronegative atoms deshield more and give larger shift values. • Effect decreases with distance. • Additional electronegative atoms cause increase in chemical shift. =>
Typical Values Chapter 13 =>
O-H and N-H Signals • Chemical shift depends on concentration. • Hydrogen bonding in concentrated solutions deshield the protons, so signal is around 3.5 for N-H and 4.5 for O-H. • Proton exchanges between the molecules broaden the peak.
The Chemical shift of a nucleus is the difference between the resonance frequency of the nucleus and a standard, relative to the standard. d = (n - nref) x106 / nref Chemical Shifts value for 1H-NMR Spectrum •Electronegative substituents are “deshielding” and shift NMR signals of nearby hydrogens to higher d values. •Ring currents associated with p-systems are “deshielding” and shift NMR signals of nearby H’s to higher d values. Downfield • H’s attached to O or N have highly variable chemical shifts which are concentration, solvent, and temperature sensitive. Source: Professor P. R. Young, University of Illinois at Chicago
Interpretation of 1H-NMR DataMultiplisitas H-H : the splitting pattern expected (if all coupling constants are equal) varies as described by Pascal's triangle: HaHb | | -C—C- | | 1 3 2 3JHH = vicinal coupling (Hz) 1st order splitting patterns
Common Splitting Patterns Singlet (s) doublet (d) triplet (t) quartet (q) pentet (p) 1:1 1:2:1 1:3:3:1 1:4:6:4:1 Isopropyl CH3CHCH3 Ethyl CH3CH2- ethyl signature: quartet / triplet with integration ratio of 2 / 3 septet / doublet & 1 / 6 ratio
Enantiotopic Distinctions • If H’s are in environments that are mirror images of each other, they are enantiotopic • Replacement of each H with X produces a set of enantiomers • The H’s have the same NMR signal (in the absence of chiral materials)
Diastereotopic Distinctions • In a chiral molecule, paired hydrogens can have different environments and different shifts • Replacement of a pro-R hydrogen with X gives a different diastereomer than replacement of the pro-S hydrogen • Diastereotopic hydrogens are distinct chemically and spectrocopically
Equivalent H’s • Two H’s that are in identical environments (homotopic) have the same NMR signal • Test by replacing each with X • if they give the identical result, they are equivalent
Solvent (deutered) 1H NMR Chemical Shift 13C NMR Chemical Shift Acetic Acid 11.65 (1) , 2.04 (5) 179.0 (1) , 20.0 (7) Acetone 2.05 (5) 206.7 (1) , 29.9 (7) Acetonitrile 1.94 (5) 118.7 (1) , 13.9 (7) Benzene 7.16 (1) 128.4 (3) Chloroform 7.26 (1) 77.2 (3) DMSO 2.50 (5) 39.5 (7) Methanol 4.87 (1) , 3.31 (5) 49.1 (7) Methylene Chloride 5.32 (3) 54.00 (5) Pyridine 8.74 (1) , 7.58 (1) , 7.22 (1) 150.3 (1) , 135.9 (3) , 123.9 (5) Water (D2O) 4.8 Chemical Shifts Value of Solvents multiplisities: 1 (singlet), 2 (doublet), 3 (triplet), et al
Solvents dH2O Acetone 2.8 Acetonitrile 2.1 Benzene 0.4 Chloroform 1.6 Dimethyl Sulfoxide 3.3 Methanol 4.8 Methylene Chloride 1.5 Pyridine 4.9 Water (D2O) 4.8 Chemical Shift of H2O (or HOD)
1H spectrum of Taxol INTEGRATION (H) Integration only gives information on the relative number of different hydrogens, not the absolute number
LATIHAN 8Hz s, 3H t, 3H q, 2H 16 Hz
Garcinia nervosa : dulxanthone G 2 x -CH3 4 x OCH3 J= 10 Hz