Download
1 / 31
310 likes | 418 Views
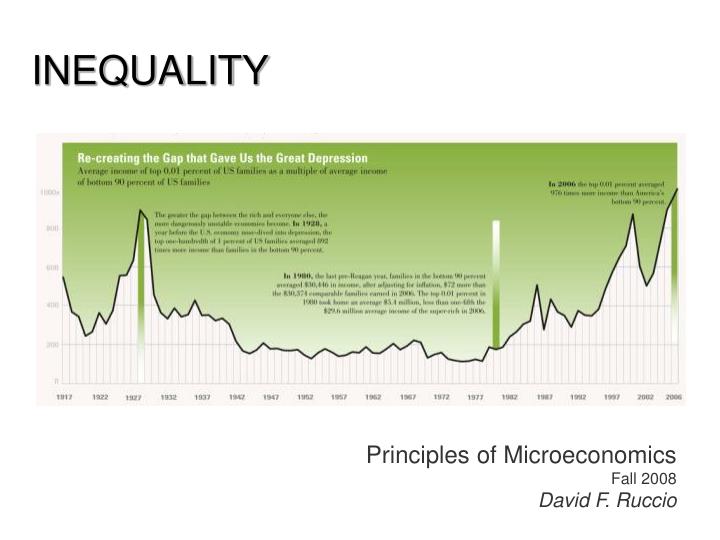
INEQUALITY. Principles of Microeconomics Fall 2008 David F. Ruccio. Source: a nalysis of U.S. Census Bureau data in Economic Policy Institute, The State of Working America 1994-95 (M.E. Sharpe: 1994), 37.

E N D
INEQUALITY Principles of MicroeconomicsFall 2008David F. Ruccio
Source: analysis of U.S. Census Bureau data in Economic Policy Institute, The State of Working America 1994-95 (M.E. Sharpe: 1994), 37
Source: Congressional Budget Office, Historical Effective Federal Tax Rates: 1979 to 2004 (December 2006), Table 1C
The CBO data show that between 1979 and 2003: • The average after-tax income of the top one percent of the population more than doubled, rising from $305,800 to $701,500, for a total increase of $395,700, or 129 percent. (CBO adjusted these figures for inflation and expressed them in 2003 dollars.) • By contrast, the average after-tax income of the middle fifth of the population rose a relatively modest 15 percent, or $5,900, reaching $44,800 in 2003. • The average after-tax income of the poorest fifth of the population rose just 4 percent, or $600, over the past 24 years. • The top one percent of the population received 12.2 percent of national after-tax income in 2003, up from its already-large 7.5 percent share in 1979. • In contrast, the shares of national income received by various groups of low- and middle-income people all fell. The middle fifth of the population received 16.5 percent of the national after-tax income in 1979, but only 15.5 percent in 2003. The bottom fifth received 6.8 percent of such income in 1979, but just 5.0 percent in 2003.
Average After-Tax Income by Income Group (in 2003 dollars) Income Category 1979 2003 % Change $ Change 1979-2003 1979-2003 Lowest fifth $13,500 $14,100 4.4% $600 Second fifth $27,300 $30,800 12.8% $3,500 Middle fifth $38,900 $44,800 15.2% $5,900 Fourth fifth $50,900 $63,600 25.0% $12,700 Top fifth $89,700 $138,500 54.4% $48,800 Top 1 Percent $305,800 $701,500 129.4% $395,700 Source: Congressional Budget Office, Effective Federal Tax Rates: 1979-2003, December 2005
Sources: Historical Statistics of the United States, Colonial Times to 1970; National Bureau of Economic Research; U.S. Bureau of Labor Statistics Note: Real wage is the nominal wage divided by the consumer price index.
Real Hourly Wage Changes, by percentile, 2003-2005 Source: Lee Price, “Why People Are So Dissatisfied with Today’s Economy,” EPI Issue Brief #219, 28 January 2006
Average Executive to Average Production Worker Pay Ratio, 1990-2005 Sources: Total executive compensation: Business Week annual compensation survey, various issues, 1991-2005. Includes: salary, bonus, restricted stock, payouts on other long-term incentives, and the value of options exercised. Average worker pay: BLS, Employment, Hours, and Earnings from the Current Employment Statistics Survey, Table B-2
Cumulative Percent Change in Economic Indicators, 1990-2005 (in 2005 dollars) CEO Pay 298.2% S&P 260.8% Profits 106.7% Worker Pay 004.3% Minimum Wage -009.3% Sources: Total executive compensation: Business Week annual compensation survey, various issues, 1991-2005. Includes: salary, bonus, restricted stock, payouts on other long-term incentives, and the value of options exercised. S&P 500 Index: Economic Report of the President, 2005 Table B-96; 1997, 2000 Table B-93; average of daily closing index. Corporate Profits: BEA, NIPA, Table 6.16, with inventory valuation and capital consumption adjustments. Average worker pay: BLS, Employment, Hours, and Earnings from the Current Employment Statistics Survey, Table B-2. Minimum wage: Lowest mandated federal minimum wage, nominal; US Dept. of Labor, Employment Standards Administration, Wage and Hour Division. Adjustment for inflation: BLS, Average Annual CPI-U, all urban consumers, all items.
Source: United for a Fair Economy, http://www.faireconomy.org/research/CEO_Pay_charts.html
Source: Dean Baker, The Productivity to Paycheck Gap: What the Data Show (April 2007 )
Value of Minimum Wage, 1947-2006 [in 2006 dollars]
A full-time worker (working 2,080 hours a year) earning $5.15 an hour would earn $10,712 a year. . . State Minimum Wages Greater than the Federal Minimum Wages
Source: Thomas Piketty and Emmanuel Saez, "Income Inequality in the United States, 1913-1998," Quarterly Journal of Economics 118 (2003). Updated to 2005 at http://emlab.berkeley.edu/users/saez
“We have heard a lot about growing income inequality. There has been much less attention paid to growing inequality in life expectancy, which is really quite dramatic.” —Peter Orszag, director of the Congressional Budget Office
Source: Economic Policy Institute, State of Working America 2006-07, Table 5.1
Sources: 1922-53: Edward N. Wolff, Top Heavy (New Press: 1996); 1962-2004: Economic Policy Institute, State of Working America 2006-07, Table 5.3
In 2003, the top one percent of the population received 57.5 percent of all capital income. This was larger than in any other year examined by the CBO, with its data going back to 1979. • The flipside of this trend is that the share of capital income that is held by the rest of the population has dropped markedly. In 2003, the bottom 80 percent of the population received only 12.6 percent of such capital income, the lowest share on record (with data back to 1979). As recently as 1989, for instance, the bottom 80 percent of the population received 23.5 percent of capital income subject to taxation, a share nearly twice as high. Source: Congressional Budget Office, Historical Effective Federal Tax Rates: 1979 to 2003, December 2005
Forbes 10 Richest Americans [net worth-September 2008] 1-Bill Gates $57 billion 2-Warren Buffett $50 billion 3-Lawrence Ellison $27 billion 4-Jim Walton $23.4 billion 5-S. Robson Walton $23.3 billion 6-Alice Walton $23.2 billion 6-Christy Walton $23.2 billion 7-Michael Bloomberg $20 billion 9-Charles Koch $19 billion 9-David Koch $19 billion
The World's 10 Richest People (March 2008) Name Citizenship Net Worth Residence ($billion) Warren Buffett United States 62 United States Carlos Slim Helú Mexico 60 Mexico William Gates III United States 58 United States Lakshmi Mittal India 45 United Kingdom Mukesh Ambani India 50 India AnilAmbani India 42 India Ingvar Kamprad Sweden 31 Switzerland KP Singh India 30 India Oleg Deripaska Russia 28 Russia Karl Albrecht Germany 27 Germany
Source: Economic Policy Institute, The State of Working America, 2002-03 (2003), Table 7.10.
Top 0.1 Percent Income Shares in the United States, France, and the United Kingdom, 1913-1998 Source: T. Piketty and E. Saez, “Income Inequality in the United States, 1913-1998,” Quarterly Journal of Economics (February 2003): 36
Source: Shaohua Chen and Martin Ravaillon, “How Have the World’s Poorest Fared Since the Early 1980s?” (World Bank)
Source: A. Maddison, The World Economy: Historical Statistics (2003)
Food for thought. . . George A. Akerlof (2003 interview with Der Spiegel): "What we have here is a form of looting. . .The rich don't need the money and are a lot less likely to spend it—they will primarily increase their savings. Remember that wealthier families have done extremely well in the US in the past twenty years, whereas poorer ones have done quite badly.” Paul Samuelson: "If we made an income pyramid out of a child's blocks, with each layer portraying $1,000 of income, the peak would be far higher than the Eiffel Tower, but almost all of us would be within a yard of the ground.” Mr. Spock of "Star Trek" (describing Ardana, where the rulers live in luxury in a cloud city above miners working in misery): "This troubled planet is a place of the most violent contrasts. Those that receive the rewards are totally separate from those who shoulder the burdens. It is not a wise leadership."