Download
1 / 22
220 likes | 347 Views
This report explores the current state of data usage among Indiana's state agencies, highlighting what we know, ongoing learning, best practices, and strategies for success. With 118 agencies interacting with various entities, significant data is collected but often underutilized. The interest in improving data usability is growing, with successful examples such as Indiana's GIS Atlas and collaborative efforts across agencies. This initiative aims to foster a data-driven culture to enhance policymaking and community services through improved data integration and accessibility.

E N D
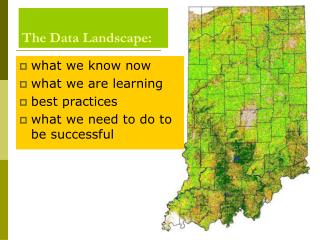
The Data Landscape: • what we know now • what we are learning • best practices • what we need to do to be successful
What we know • 118 state agencies and commissions • Each interacts with someone or something • Many collect data about those interactions • Much of that data can be put to use for policy and decision making IF it is made useable
What we are learning • There is great interest in many state agencies to make their data more useful • There are issues of resources • Some are ready now to go to the next level of usability – for example, Indiana Department of Workforce Development, Department of Local Government Finance
Good practices • A GIS Atlas for Indiana • SAVI for Central Indiana • Indiana Agriculture Statistics
Available now – example: View 2005 Data Release Calendar by Topic • Bankruptcy • Births • Business by Size • Commuting • Consumer Price Index • Deaths • Education • Employment & Wages • Exports • Gross Domestic and State Products • Housing • Income and Poverty • Manufacturing • Marriage • Occupations • Population • Research and Development • Taxes • Unions • Vehicles • Welfare
Access Indiana • About Indiana • Business • Tourism • Recreation • Labor • Employment • Education • Training • Licensing Permits • Family • Health • Safety • Taxes • Finance • Agriculture • Environment • Travel • Transportation • Law Justice • Public Assistance • Local Resources • Technology Lots of information, but no central resource for statistics. Although of course it links to STATS Indiana
Indiana Department of Workforce Development and the IBRC • Already working toward integration model • Improving access to summary claims with demographics of unemployed requesting and/or receiving benefits • Improving access to ES-202 • New value-added data focus for regional planning
DigitalGovernment • National Science Foundation The Digital Government Program funds research at the intersection of computer information sciences and government information services, with the goal of bringing advanced information technology to the government information community. These Government/academic collaborations should contribute to government strategic planning for information services while providing interesting and unique new research problems and data sets for the academic research community.
National Infrastructure for Community Statistics – Emerging Toolkit • Automating Integration of Large Heterogeneous Databases - Information Sciences Institute, University of Southern California • Visualizing Federal Statistics, Geovista Lab, Pennsylvania State University • Data Swapping and Other Data Confidentiality Tools - National Institute for Statistical Sciences
HUD - HMIS • Homeless Management Information System (HMIS). Communities are challenged to integrate data from multiple systems for the purpose of generating a more complete picture of the extent of homelessness and the demographics and needs of persons served within their jurisdictions.
Local Employment Dynamics • Federal-State collaboration to integrated UI data with CPS, SS data • Yields: job creation, new hire wages vs. existing wages, establishments births and deaths, age and sex composition of workforce by industry • Because Indiana is emerging as a workforce data leader, we have been invited to talk at the federal table about our recommendations for improvements
What we are doing • Inventory of key data – including information on variables, collection forms, platforms, metadata, etc. – that are currently collected and maintained by state agencies. • Identify data currently available publicly and/or for research use. • Develop list of known issues with access and use of state agency data. • Identify public access and confidentiality laws relevant to each agency identified as “key”. • Build integrated database of forms, variables, metadata and create a line of sight matrix to determine similarities and differences.
What the University community will bring to the Indiana Data Initiative • Facilitate and collaborate to create a collective vision among providers, researchers and policy makers • Articulate the policy-based research agenda • Build relationships • Build the infrastructure • Development of statistical methods to enable the integration of administrative records to create new and more useful data • Central server and security functions • Technical assistance • Skill building
What the Governor’s Office can bring: • Create a culture of agency commitment to • Articulate a policy-based research agenda. • Facilitate and collaborate with key data providing agencies to help create the common vision. • Provide access to forms and processes and the people who implement them to help create an inventory of State data. • Recommendat and implement key policy changes, perhaps even code changes to enable the building of databases to serve policy-based research needs.
What you can bring to the table • Your needs • Your vision • Your help and that of your organizations Sign up for our IDI list serve to receive status reports, provide feedback, learn and share. www.ibrc.indiana.edu/idi