Download
1 / 28
280 likes | 379 Views
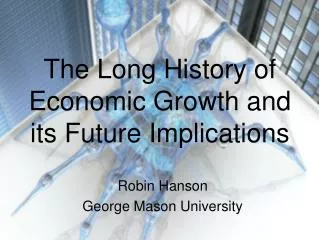
IFIP/IIASA/GAMM Workshop on Coping with Uncertainty (CwU) Robust Decisions, December 10-12 2007, IIASA, Laxenburg, Austria. Stochastic Detection Time Concept and its Economic Implications. M. Makowski, T. Ermolieva, M. Jonas, Y. Ermoliev. Outline.

E N D
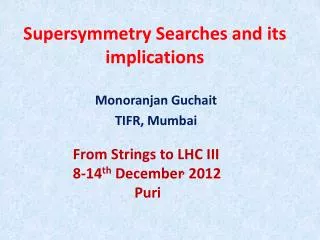
IFIP/IIASA/GAMM Workshop on Coping with Uncertainty (CwU) Robust Decisions, December 10-12 2007, IIASA, Laxenburg, Austria Stochastic Detection Time Concept and its Economic Implications M. Makowski,T. Ermolieva, M. Jonas, Y. Ermoliev
Outline 1. Kyoto protocol and detection of emissions 2. Uncertainty (Variability) matters 3. Practical Example: Long time data series 4. Variability of emissions: “fast” and “slow” systems 5. Emission signal detectability: stochastic detection techniques 6. Emissions trading markets; b. insurance of carbon credits transactions
Kyoto protocol and detection of emissions Kyoto – binding commitments to limit or reduce the emissions of six GHGs or groups of gases (CO2, CH4, N2O, HFCs, PFCs, and SF6). Each Party of the protocol calculates how much of gases its country emits by adding together estimates/reported emissions from individual sources. Often estimated/reported emissions are inaccurate: M. Gillenwater & F. Sussman & J. Cohen: Practical Policy Applications of Uncertainty Analysis for National Greenhouse Gas Inventories. In many countries, agreed emission changesare smaller than their underlying uncertainty. In IPCC practice, emission/emission changes are reported, but without rigorous signal detection
S2 The KP requires that net emission changes be “verified” on the spatial scale of countries by the time of commitment, relative to a specified base year. • The key questions: • Whether reported emissions outstrip uncertainty and can • be “verified/detected” ? • 2. What percentage of all possible emissions can be • detected within a given time ?
Uncertainty (variability) matters Net Emissions Below the target,larger uncertainty Below the target, smaller uncertainty Net Emissions Below the target,larger uncertainty Above the target,smaller uncertainty Source: M. Jonas et. al.
Variability matters 95th confidence = Net Emissions
Variability matters 95th confidence 95th confidence C C Net Emissions A B Base year Commitment year/period B
Practical examples Longer data time series on FF, LUC and OU taken from global carbon budget: http://lgmacweb.env.uea.ac.uk/lequere/co2/carbon_budget.htm Fossil Fuel Emissions (FF) are estimated from data on the global consumption of coal, oil, and natural gas. The Land Use Change (LUC) are estimated using a bookkeeping model updated in August 2006 using revised data from the FAO of the United Nations. The mean Ocean Uptake(OU) for 1959-2005 is estimated using an ocean general model forced by observed atmospheric conditions of weather and CO2 concentration. The terrestrial uptake is estimated as a residual of all the sources minus the ocean uptake and atmosphere increase (Assessment Report 4, WG 1, Ch. 7, 2007, p. 519).
Variability of emissions: “fast” and “slow” emissions dynamics Fossil Fuels: strong dynamics, small variability Net terrestrial: slow dynamics, large variability http://lgmacweb.env.uea.ac.uk/lequere/co2/carbon_budget.htm
0.20 0.15 0.10 0.05 1961 1963 1965 1967 1969 0.00 -0.05 y = 0.0239x - 0.2415 R2 = 0.6931 -0.10 -0.15 -0.20 -0.25 -0.30 Data De-trended Trend Data series Net Emissions
Slow dynamics vs large variability: Net terrestrial uptake, 1960-1970 Net Emissions Pg C/yr More emissions below average !
Slow dynamics vs large variability: Net terrestrial uptake, 1985-1995 Net Emissions Pg C/yr More emissions above average !
Fast dynamics vs small variability: Fossil fuel emissions, 1960-1970 Net Emissions Pg C/yr More emissions below average !
Fast dynamics vs small variability: Fossil fuel emissions, 1985-1995 Net Emissions Pg C/yr More emissions above average !
The need for “detection” of emission shapes 1. In 1960 to 1970, the terrestrial system was mostly a sink. 2. Average flow -0.13. Higher likelihood of flows larger than average. 3. More of probability mass below average 4. In 1985 to 1995, it turned to source. Average flow 0.6. 5. More of probability mass above average.
Net Emissions 2e e = const time t1 t2 ΔF> ε at t*=DT 2e ε ΔF e = const time t1 t2 t*=DT Emission signal: detectability Detect time when emission outstrips the uncertainty represented by a symmetrical interval
Emission signal: detectability Net Emissions e2 Net Emissions e2 e2 e1 e1 e1 b) a) time t2 t1 DT = t2 time t2 t1 DT < t2 Net Emissions c) DT > t2 time t2 t1
Stochastic detection of emission signal Net Emissions Fmax ε2 ε1 Fmin time DT < t2 DT > t2 t2 t1
1.0 0.9 95th percentile 0.8 Value: 54.7 0.7 Mean Average: 17.7 0.6 0.5 Median: 15 0.4 0.3 E-sided approach: 7.9 0.2 E-sided approach: 7.9 0.1 0.0 Years 0.00 4.21 8.42 67.34 21.04 25.25 29.46 33.67 37.88 42.09 46.30 50.50 63.13 12.63 16.83 54.71 58.92 E-sided vs stochastic detection, slow dynamics and large variability: Net terrestrial uptake, 1965 – 1985
E-sided vs stochastic detection, slow dynamics and large variability: Net terrestrial uptake, 1965 – 1985
Mean E-sided approach: 0.9 Years E-sided vs stochastic detection, fast dynamics vs small variability: Fossil fuel emissions, 1965 – 1985
Economic implications of emissions uncertainties: stochastic detection techniques • Emissions are tradable commodities. • 2. Variability of emissions is a key element for pricing commodities: • 2.a. Inclusion of various systems (forestry and land use CDMs) in emission trading • markets: Carbon Market Europe, 21, 2006. (Available on request) • 2.b. Slow dynamic systems (forestry, land use) long response times. • (The “must” for an appropriate emission detection technique - affects prices.) • 2.c. Emissions banking: temporal discounting of emissions • 2.d. Emissions borrowing • 2.e. Initial allowance allocation: • grandfathering, • equal emissions per capita, • equal emissions per unit GDP; • spatio-temporal discounting of emissions uncertainties, fairness. Stochastic detection: what percentile of possible emissions is detectable within a given time interval. This allows to compare and rank the parties in terms of their compliance potential (risks of not compliance).
Emissions banking and borrowing Alternative emission trading schemes: • reduction credit trading, • emission rate averaging, and • cap-and-trade programs, Emissions banking: complements emission trading programs Banking provides flexibility to deal with many uncertainties associated with emissions trading market Allows inter-temporal trading of emissions Reliability of emissions estimates plays essential role in Inter-temporal discounting and trading of emissions Effective banking improves environmental performance and reduces cumulative compliance costs http://www.pewclimate.org/docUploads/emissions_trading.pdf
Applications of emission detection and verification techniques for emission control policies • Ermoliev, Y., G. Klaassen and A. Nentjes (1996): The design of cost effective ambient charges under incomplete information and risk. In: E.C. van Ierland and K. Gorka (eds.) Economics of Atmospheric Pollution, NATO ASI Series, Partnership Sub-Series, 2. Environment, V. 14, 123–151, Springer, Berlin, Germany. A deterministic and a stochastic technique is proposed to find the cost-effective vector of emissions through adaptation of emission charges in successive steps. • Ermoliev, Y., M. Michalevich and A. Nentjes (2000): Markets for tradable emission and ambient permits: A dynamic approach. Environ. Res. Econ., 15, 39–56. Sequential trading schemes in pollution permit markets are discussed in stochastic settings. The paper emphasized the need for an appropriate treatment of uncertainties and risks associated with emissions by designing specific risk-adjusted goal functions. Was shown that in order to reach the least-cost solution, the parties must reduce their emissions uncertainties. • Godal O., Y. Ermoliev, G. Klassen and M. Obersteiner (2003): Carbon trading with imperfectly observable emissions. Environmental and Resource Economics, 25, 151–169.
Sequential bilateral trading of emissions • Scheme of sequential bilateral trade (in cap-and-trade scheme) takes into account safety constraints, i.e., risks of underestimating and overestimating real emissions. • Global least cost solution for all parties. • Cooperation through the bilateral trading reduces not only the aggregate cost, but this is achieved in a mutually beneficial way reducing individual costs. • All participating parties create the stable coalition. • In sequential trading, a stochastic detection technique (SDT) provides information as to what percentile of emissions and variability of a party is detectable in a certain time. • The (SDT) “informs” the economic model of sequential bilateral trading • as to how much and what is the likelihood of “free” emissions that a • party can trade.
Summary Stochastic detection technique: Percentage of possible emissions detectable within a given time Contrary to e-sided, captures variability of emissions Applicable for/to evaluation of carbon related financial instruments (emission trading, investments, Kyoto related mechanisms) On-going research: Development of specific risk-adjusted pricing procedures for emissions-related products Clean Development Mechanisms (CDM), Joint Implementation (JI) projects. CDM (including emission trading) insurance: emissions uncertainties are prices. Insurance of “skewed” risks of emissions trading is similar to Catastrophic risks insurance. Emission trading and endogenous discounting: credibility of parties is translated into discounting of emissions permits Principles for allocation of emissions allowances: pros and cons of grandfathering, fairness, temporal discounting of emission reduction technologies
References Jonas, M., S. Nilsson, R. Bun, V. Dachuk, M. Gusti, J. Horabik, W. Jęda and Z. Nahorski, 2004: Preparatory Signal Detection for Annex I Countries under the Kyoto Protocol―A Lesson for the Post-Kyoto Policy Process. Interim Report IR-04-024, International Institute for Applied Systems Analysis, Laxenburg, Austria, pp. 91. Available at: http://www.iiasa.ac.at/Publications/Documents/IR-04-024.pdf. Jonas, M. and S. Nilsson, 2007: Prior to an economic treatment of emissions and their uncertainties under the Kyoto Protocol: Scientific uncertainties that must be kept in mind. Water, Air & Soil Pollution: Focus. Available at: http://dx.doi.org/10.1007/s11267-006-9113-7. Nahorski, Z., J. Horabik and M. Jonas, 2007: Compliance and emissions trading under the Kyoto Protocol: Rules for uncertain inventories. Water, Air & Soil Pollution: Focus. Available at: http://dx.doi.org/10.1007/s11267-006-9112-8. Nilsson, S., M. Jonas, V. Stolbovoi, A. Shvidenko, M. Obersteiner and I. McCallum, 2003: The missing “missing sink”. The Forestry Chronicle, 79(6), 10711074. Pearce, F., 2006: Kyoto promises are nothing but hot air. New Scientist, 22 June. Available at: http://environment.newscientist.com/channel/earth/mg19025574.000-kyoto-promises-are-nothing-but-hot-air.html. Rödenbeck, C., S. Houweling, M. Gloor and M. Heimann, 2003: CO2 flux history 1982–2001 inferred from atmospheric data using a global inversion of atmospheric transport. Atmos. Chem. Phys., 3, 1919–1964.
References Ermoliev, Y., Klaassen, G., Nentjes, A. The design of cost effective ambient charges under incomplete information and risk. NATO ASI Series, Partnership Sub-Series, 2. Environment, V. 14: Economics of Atmospheric Pollution. Edited by Ekko C. van Ierland and Kazimierz Gorka, Springer Verlag, Berlin-Heidelberg, 1996. Ermoliev, Y., M. Michalevich and A. Nentjes, 2000: Markets for tradable emission and ambient permits: A dynamic approach. Environmental and Resource Economics 15, 39–56. Gillenwater, M., F. Sussman and J. Cohen, 2007: Practical policy applications of uncertainty analysis for national greenhouse gas inventories. Water, Air & Soil Pollution: Focus. Available at: http://dx.doi.org/10.1007/s11267-006-9118-2. Godal, O., 2000: Simulating the carbon permit market with imperfect observations of emissions: Approaching equilibrium through sequential bilateral trade. IIASA Interim Report IR-00-060, International Institute for Applied Systems Analysis, Laxenburg, Austria, pp. 25. Available at: http://www.iiasa.ac.at/Publications/Documents/IR-00-060.pdf. House, J.I., I.C. Prentice, N. Ramankutty, R.A. Houghton and M. Heiman, 2003: Reducing apparent uncertainties in estimates of terrestrial CO2 sources and sinks. Tellus55B, 345–363. Hudz, H., 2003: Verification Times Underlying the Kyoto Protocol: Consideration of Risk. Interim Report IR-02-066, International Institute for Applied Systems Analysis, Laxenburg, Austria, pp. 34. Available on the Internet: http://www.iiasa.ac.at/Publications/Documents/IR-02-066.pdf. Jonas, M., S. Nilsson, M. Obersteiner, M. Gluck and Y. Ermoliev, 1999: Verification Times Underlying the Kyoto Protocol: Global Benchmark Calculations. Interim Report IR-99-062, International Institute for Applied Systems Analysis, Laxenburg, Austria, pp. 43. Available on the Internet: http://www.iiasa.ac.at/Publications/Documents/IR-99-062.pdf.