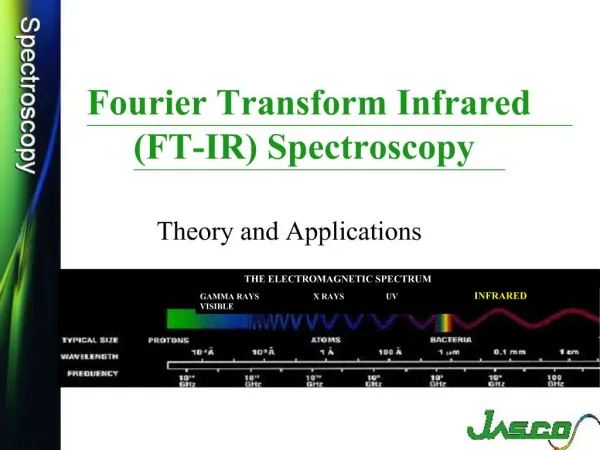
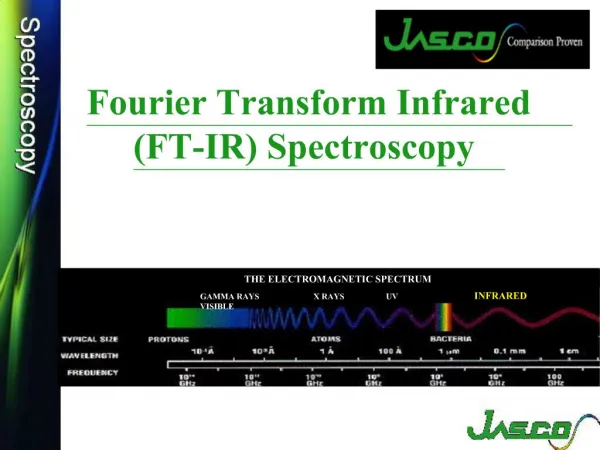
Fourier Transform Spectroscopy (FTS)
Fourier Transform Spectroscopy (FTS). Yousaf Iqbal PEP Uni-Bremen. Outlines. Introduction to FT – IR Why Infrared spectroscopy FT – IR is preferred over dispersive IR spectropscopy Working Principle of FT – IR Michelson Interferometer Interferrogram & Fourier transformation

Fourier Transform Spectroscopy (FTS)
E N D
Presentation Transcript
Fourier Transform Spectroscopy (FTS) Yousaf Iqbal PEP Uni-Bremen
Outlines • Introduction to FT – IR • Why Infrared spectroscopy • FT – IR is preferred over dispersive IR spectropscopy • Working Principle of FT – IR • Michelson Interferometer • Interferrogram & Fourier transformation • Advantages of FT – IR • Instrument in Bremen • How to get Transmission spectrum • Summary • Acknowledgement
Introduction to FT – IR • FT – IR stands for Fourier Transform Infrared. Informations provided by FT – IR • Identify unknown material. • Determine the amount of component in a mixture. • Determine the quality of a sample. www.thermonicolt.com
Why Infrared Spectropcopy • In infrared spectrum, apsorption peaks represent a fingerprint of a sample. • Absorption peaks --- frequencies of vibrations between bonds of atoms. • Different sample --- unique combinations of atoms. • No two compounds produces same spectrum. • Qualitative analysis of the sample. • Size of peaks ---- amount of material present.
FTS is preferred over dispersive IR spectropscopy • Non-despersive technique • Provides presise measurement method without external calibration. • Greater optical throughput. • Mechanically simple (only one moving part)
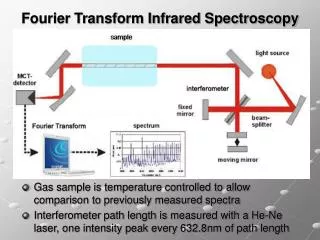
Working Principle of FT – IR • Infrared light emitted from the source. • Emitted light is directed into the interferrometer. • After interferrometer, light passes through the sample compartmet. • At the end focused on the detector. • The signal measured by the detector is called interferrogram. General FT-IR Spectrometer layout Bruker Optics http://www.brukeroptics.com/
Bruker Optics http://www.brukeroptics.com/
Michelson interferrometer Bruker Optics http://www.brukeroptics.com/
high low high S D S S Intensity dOOOOOOPD Signal position Signal Measured d dOPD at detector (time average) Interference pattern Dr. Justus Notholt Institute for Environmetal Physics University of Bremen
http://www.wooster.edu/chemistry/is/brubaker/ir/ir_works_modern.htmlhttp://www.wooster.edu/chemistry/is/brubaker/ir/ir_works_modern.html
Interferogram & Fourier transformation • Interference ---- Resulting singnal is called Interferogram. • Make up the signal having information about every IR frequency which comes from source. • For identification, frequency spectrum is requried. • Means of decording frequency via Fourier transformation. Bruker Optics http://www.brukeroptics.com/
Advantages of FT – IR • Light throughput advantage (Jaquinot advantage) • Multiplex principle (Fellget advantage) • Wavelength accuracy (Connes advantage) • Mechanical Simplicity
Grating FTS Grating Circular aperture more light Light throughput advantage (Jacquinot Advantage) Dr. Justus Notholt Institute for Environmetal Physics University of Bremen
Multiplex principle (Fellget advantage) • All wavelengths at once. • More light (for single detectors)
FTS Grating He-Ne laser 632.8 nm Wavelength accuracy (Connes Advantage) sin a ~ l Intensity dx 632.8 nm
Mechanical Simplicity • Only moving mirror in FTS • Little possibility of mechanical breakdown.
Observations onboard of polarstern Cruise Dr. Justus Notholt Institute for Environmetal Physics University of Bremen
How to obtained Transmission spectram Bruker Optics http://www.brukeroptics.com/
The final Tramission Spectrum Bruker Optics http://www.brukeroptics.com/
Comparison between the emission line (TB,a) and absorption lines of gases from the database TB,a H2O CO2 Intensity CH4 Wavenumber cm-1 Yousaf Iqbal and Irshad Ahmad University of Bremen
Summary • FTS was developed in order to overcome the limitations of despersive instruments. • Fts measures all frequencies of IR simultaneously. • Interferometer ---- interferogram------ Fourier transformation of interferogram ---- spectrum
Acknowledgements • http://www.thermonicolt.com • Bruker Optics http://www.brukeroptics.com/ • Dr. Justus Notholt Institute for Environmetal Physics University of Bremen • http://www.wooster.edu/chemistry/is/brubaker/ir/ir_works_modern.html
Thanking you • Any questions Please


![Fourier transform infrared spectroscopy[FTIR]](https://cdn1.slideserve.com/2743434/fourier-transform-infrared-spectroscopy-ftir-dt.jpg)