Download
1 / 14
200 likes | 452 Views
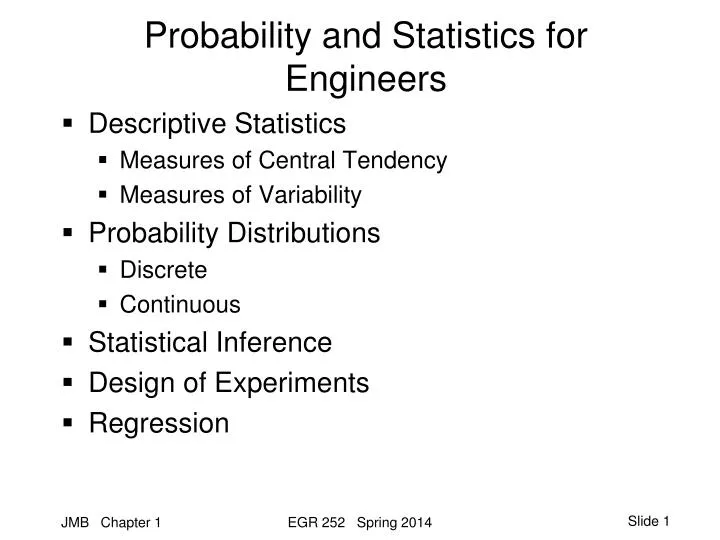
Probability and Statistics for Engineers. Descriptive Statistics Measures of Central Tendency Measures of Variability Probability Distributions Discrete Continuous Statistical Inference Design of Experiments Regression. Descriptive Statistics.

E N D
Probability and Statistics for Engineers • Descriptive Statistics • Measures of Central Tendency • Measures of Variability • Probability Distributions • Discrete • Continuous • Statistical Inference • Design of Experiments • Regression EGR 252 Spring 2014
Descriptive Statistics • Numerical values that help to characterize the nature of data for the experimenter. • Example: The absolute error in the readings from a radar navigation system was measured with the following results: • the sample mean, x = ? 17 22 39 31 28 52 147 EGR 252 Spring 2014
Calculation of Mean • Example: The absolute error in the readings from a radar navigation system was measured with the following results: _ • the sample mean, X = (17+ 22+ 39 + 31+ 28 + 52 + 147) / 7 = 48 17 22 39 31 28 52 147 EGR 252 Spring 2014
Calculation of Median • Example: The absolute error in the readings from a radar navigation system was measured with the following results: • the sample median, x = ? • Arrange in increasing order: 17 22 28 31 39 52 147 • n odd median = x (n+1)/2 , → 31 • n even median = (xn/2 + xn/2+1)/2 • If n=8, median is the average of the 4th and 5th data values. 17 22 39 31 28 52 147 ~ EGR 252 Spring 2014
Descriptive Statistics: Variability • A measure of variability • Example: The absolute error in the readings from a radar navigation system was measured with the following results: • sample range = Max – Min = 147 – 17 = 130 17 22 39 31 28 52 147 EGR 252 Spring 2014
Calculations: Variability of the Data • sample variance, • sample standard deviation, EGR 252 Spring 2014
Other Descriptors • Discrete vs Continuous • discrete: countable • continuous: measurable • Distribution of the data • “What does it look like?” EGR 252 Spring 2014
Graphical Methods – Stem and Leaf Stem and leaf plot for radar data Stem Leaf Frequency 1 7 1 2 2 8 2 3 1 9 2 4 5 2 1 6 7 8 9 10 11 12 13 14 7 1 EGR 252 Spring 2014
Graphical Methods - Histogram • Frequency Distribution (histogram) • Develop equal-size class intervals – “bins” • ‘Rules of thumb’ for number of intervals • 7-15 intervals per data set • Square root of n • Interval width = range / # of intervals • Build table • Identify interval or bin starting at low point • Determine frequency of occurrence in each bin • Calculate relative frequency • Build graph • Plot frequency vs interval midpoint EGR 252 Spring 2014
Data for Histogram • Example: stride lengths (in inches) of 25 male students were determined, with the following results: • What can we learn about the distribution (shape) of stride lengths for this sample? EGR 252 Spring 2014
Constructing a Histogram • Determining frequencies and relative frequencies EGR 252 Spring 2014
Computer-Generated Histograms EGR 252 Spring 2014
Relative Frequency Graph EGR 252 Spring 2014
Graphical Methods – Dot Diagram • Dot diagram (text) • Dotplot (Minitab) EGR 252 Spring 2014