Download
1 / 46
770 likes | 1.42k Views
Development indicators. And what they tell us? APHG – Keller 2011. What does development look like?. What does development look like?. What does development look like?. Concepts of Development. Developed vs underdeveloped Developing? LDC vs MDC (LEDC vs. MEDC)

E N D
Development indicators And what they tell us? APHG – Keller 2011
Concepts of Development • Developed vs underdeveloped • Developing? • LDC vs MDC (LEDC vs. MEDC) • NICs (Newly Industrialized Countries)
UNHDP – United Nations Human Development Program • GDP is too general and does not tell you enough about the people. • While things like life expectancy is a little too specific – although as all sorts of other indicators influence this one, it is very important one. • But if you know how much education people get, together with how long they are likely to live and thrown in the GDP as well, you have a reasonable measure of development. • This is exactly what the UN did in 1990
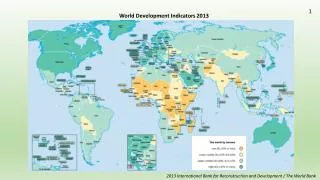
Each year, the countries are ranked. High human development cut-off point is 0.8 Middle is above 0.5 to 0.8 Low is 0.1 – 0.5 HDI and the UN - 2008
How does the Human Development Index (HDI) work? • The UN looks at GDP per capita, Life expectancy and an educational index – • It assessed what it thought is the best each can aspire to • It finds the difference between each countries value and the maximum, which is then divided by the maximum – so no value can be more than 1 • Then averages them • So a perfect country will have an HDI of 1 • A less developed country with have much lower value.
HDI - Issues • While this is much more effective way of measuring change across the world the group at the top are very close together • The difference of a year in life expectancy can cause a change of several places on the list. • Also, when it started the maximum value GDP was $40,000 – several countries near the top have overtaken this and so are given a rating of 1 • In other words once you reach a GDP of $40,000 dollars you don’t get any more points – so a country with a lower GDP and only slightly better other indicators will go higher up the index
A definition of development • Development is the improvements in standard of living and quality of life that follow on from a country becoming richer. • In other words, the country needs the money, but how it is shared and spent affects the level of development a lot. • We are going to look at: • Different development indicators • How a realistic measure of economic development has been created by the UN • The development in 3 particular countries
Development indicators • Beginning in 1990, The UN has annually produced over 30 tables containing more than 200 indicators. • These are grouped together by topic, e.g. poverty, trade, gender issues • This is far too many! So we will look at a few representative ones under the headings of • Economic • Population • Social
Core Periphery Model • Scholars argued for this new approach • Sensitive to geographical differences and the relationships among development processes occurring in different places • Focuses on economic relationships • Core • Periphery • Semi periphery
Core Periphery Model • Core Regions • High levels of socioeconomic prosperity • Dominant players in global economic game • Anglo America HDI .94 • Japan and the South Pacific HDI .93 • Western Europe HDI .92 • Eastern Europe HDI .78
Core Periphery Model • Periphery • Poor regions • Dependent on the core • Do not have much control over their own affairs
Periphery Regions • Latin America HDI .78 • East Asia HDI .72 • Southeast Asia HDI .71 • Middle East HDI .66 • South Asia HDI .58 • Sub Saharan Africa HDI .47
Core Periphery Model • Semi Periphery • Regions that exert more power than periphery regions • Dominated to some degree by core
The North South Divide http://en.wikipedia.org/wiki/Image:Northsouth.png Based on the 1980’s Brandt Report. Suggested a simplified world contrast of development and undevelopment based on degree of industrialization and per capita wealth.
These are 2007 figures Economic Indicators Which do you think these countries are: MEDCs, NICs, LEDCs, LLEDCs? As we will see, your text, other sources and me have slightly different ideas on this! And as the world economy and general situation changes, so do individual countries – so don’t worry about finding THE right answer – there isn’t one!
The GDP is the best known but as we have seen it has its limitations even though it does tell of something • Qu1: Why is electricity consumption used as an economic indicator – it is not just about electric lights in the home! • Qu 2: If the GDP=$100, Sweden buys imports for $35 and sells exports for $40 – so it gets richer – what is happening to each country?
Growth rate = Death rate – birth rate 1. What do you expect the birth rate to be like in different economic groups? 2.The death rate? 3. Life expectancy is a major indicator of development because it has links with all sorts of other things. What? 4. What can you say about urban populations ? Population indicators
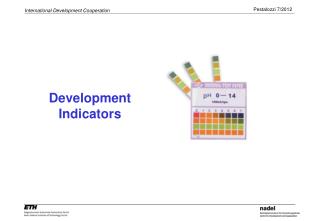
The gaps are left because: Either it would cost lots to find out what we know – an answer of about 99% Or in the case of China’s secondary education – they don’t divide it up that way Social Indicators
The doctors per 100,00 does not say much – work out how many one doctor serves in each country – what does that tell you? Remember: 2,200 – 3,000 calories is about the range for quite active people – less and you are hungry – more are you are likely to be obese – what do the figures tell you? What is adult literacy like: in MEDCs & NICs? In LEDCs & lower? Primary education is one of the Millennium Goals – they are not doing too bad? Not the same in secondary education?? Social Indicators
Individual country case studies • We have 2 to look at: • They are Italy and Brazil • For a number of reasons, you will not be expected to remember numbers, but be able to take data from tables/graphs and comment on them. • But you will be expected to know something about what the countries are like, and how the data you are given reflects that • E.g. birth rates: from Brazil you would be expected to see that they were higher than MEDCs but that they were coming down – not on the table!!
Case study –Italy • Indicators (mostly 2008 estimate) • Area: 301,230 sq km • Population: 58,145,320 • GDP - per capita :$31,000 • Birth rate: 8.36 births/1,000 population • Death rate: 10.61 deaths/1,000 population • Life expectancy at birth: 80.07 years • Infant mortality rate: 5.61 deaths/1,000 live births • People per doctor: 238 • % working in farming: 4%
Aging pop. Slow growth High life expectancy Low birth/death rates Low infant mortality Case study –Italy
Case study –Italy This one shows where the money comes from What do you think the bar chart shows? Primary is what? 2% of the money but 4% of the jobs – what does that say? This one shows where the jobs come from
Some other things that may influence development • Large areas of fertile land used intensively for vines, arable crops and vegetables • The mountainous regions of the Southern Alps and the Apennines, the mountains ridge down the middle of Italy, are very suitable for HEP (hydro-electric power). • There is a long history of manufacturing for export – machinery, textiles, clothing, vehicles. • Energy use: 22 barrels of oil equivalent per person per year
Some other things that may influence development • Problems: • summer droughts, • Volcanoes/ earthquakes • recession has had an impact • Congestion and pollution in the cities – Milan, Venice, Rome • Biggest problem is underdevelopment in the south – but more of that another day!
Case study –Brazil • Indicators (mostly 2008 estimate) • Area: 8,511,965 sq km • Population: 196,342,592 • GDP - per capita $10,300 • Birth rate: 18.72 births/1,000 population • Death rate: 6.35 deaths /1,000 population • Life expectancy at birth: 71.71 years • Infant mortality rate: 23.33 deaths/1,000 live births • People per doctor: 485 • % working in farming: 20%
Case study –Brazil Little one of Italy to compare with Not many reaching retiring age Large numbers of children but falling
Case study –Brazil Notice any differences? What has happened to the Brazilian population in the last 60 years?
Case study -Brazil • The book says Brazil is an LEDC, but according to UN’s HDI it has just reached ‘the top table’ as it is listed as one of the countries with High Human development • It still has some distance to go in terms of life expectancy and literacy but it is well on the way. • It is certainly newly industrialised – it is in the forefront of ethanol production (made from bagasse – waste sugarcane stubble) – and has numerous projects to improve its environmental track record in farming. • Of course there are still issues over the Amazon rainforests. • But there are also improvements being made to the favelas (squatter settlements) on the edges of the big cities – more about that another day
Some other things that may influence development • Problems: • There is a wide gap between the very rich and the very poor • Business is allowed to get away with environmentally unfriendly activity, because they have the money to pay their way – quite often possibly through bribery and corruption. • The human rights need a lot of work, especially if you are poor.
Models of Development • Liberal Models • All countries are capable of development • Economic disparities are a result of short term inefficiencies in local or regional market forces
Models of Development • Structuralist Models • Regional disparities are a structural feature of the global economy • Things have come to be organized or structured in a way and cannot be changed easily
Modernization Model • Walt Rostow, 1950’s • Liberal model • Development through international trade • Suggests that all countries follow a similar path through economic development • Traditional • Preconditions to takeoff • Takeoff • Drive to maturity • High mass consumption
Traditional • Not yet started development • High % of people engaged in subsistence agriculture • High % of wealth allocated to ‘nonproductive activities’ such as religion and military • Rigid and unchanging social structure • Resistance to change to technological change
Preconditions of Takeoff • An elite group initiates innovative economic activity • Country begins investing in new technology and infrastructure • Stimulate increase in productivity • Progressive leadership
Takeoff • Rapid growth facilitated by a limited number of economic activities • Some sectors of the economic structure remain dominated by traditional practices • Industrialization, urbanization, mass production
Drive to Maturity • Modern technology diffuses to wide variety of industries • Industries experience rapid growth similar to the early takeoff industries • Workers become more skilled and specialized • Modernization in the core • Population growth declines
High Mass Consumption • Economy shifts from production of heavy industry such as steel and energy to consumer goods like refrigerators and motor vehicles • High incomes • Widespread production of a variety of goods and services • Majority of workers in service sector of economy
Dependency Theory • Structuralist alternative to Rostow’s model • Political and economic relationships between countries and regions control and limit the economic development of less well off regions • Dependency helps sustain the prosperity of the dominant regions and the poverty of the lesser regions
Dependency Theory • Little hope for economic prosperity in regions and countries that have traditionally been dominated by external power • Based on generalizations that pay little attention to regional differences in culture, politics, and society
Why do LDC’s face obstacles to development? • Self-sufficiency • International trade • Financing development