Download
1 / 17
170 likes | 192 Views
Ian Roberts MRC Cancer Cell Unit Hutchison MRC Research Centre ir210@cam.ac.uk. Genomic Arrays: Tools for cancer gene discovery. What’s a genomic array?. A platform of regularly spaced genomic sequences All known genes or a subset of genes of interest

E N D
Ian Roberts MRC Cancer Cell Unit Hutchison MRC Research Centre ir210@cam.ac.uk Genomic Arrays:Tools for cancer gene discovery
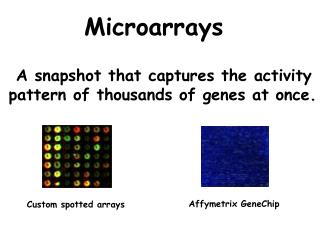
What’s a genomic array? A platform of regularly spaced genomic sequences All known genes or a subset of genes of interest A tool for querying the genome about damage Genomic gains (oncogenes) Genomic losses (tumour suppressor genes) Applications Research disease gene discovery Clinical diagnostic tests
Comparative genomic hybridisation GAIN: More test probe than reference probe (oncogene) LOSS: Reference probe in excess of test (tumour suppressor) Array platform Vast majority is normal Available probe + Tumour DNA (Test) Normal DNA (Reference)
New generation arrays produce large amounts of data Agilent 244K array Raw data is foreground and background signal intensities in two channels Median ratio of foreground is important. 243,504 defined spots
aCGH data analysis ... ... using camgrid
Genomic array analysis strategy using R • array data is processed by snapCGH R package • Correct array data for background noise and mean distribution • Order data by genomic location • Apply an aCGH segmentation algorithm • Draw some plots • Determine significant findings (in house R functions) • Common and minimum genomic regions of gain and loss • Summarise output R www.cran.r-project.org snapCGH www.bioconductor.org parrot R on camgrid http://www.bio.cam.ac.uk/local/condor-parrot.html
Old vs. New genomic array plots Chromosome 7
Input data to snapCGH (e.g. 3 chrs, 2 analysis methods) Preprocess data Condor Job 1 Chr 1 Chr 2 Chr 3 Generate genome ordered data and condor dagman analysis batch files DNA copy GLAD DNA copy GLAD DNA copy GLAD Condor Job 2 Perform aCGH analysis + region detection (1 run per Chr per analysis method) DNAcopy dagman description file Segmentation Step 1. Clone call scoring Dagman job 1 … n CRI MRI Detection n. Clone call scoring Score combining Distributed aCGH analysis Consolidate output
Condor job scripting in BASH & R • BASH function • Responsible for producing required condor files for discrete jobs • Default_submit has 2 positional parameters • R script name $1 • Data files $2 • Initiates aCGH analysis on grid. • Condor dagman R function set • R-scripter • Writes the appropriate R script for the current job • R-condor-submitter • Writes the condor job submission file • R-condor-executer • Writes the condor job executable file • R-job-descriptor • Writes the condor dagman description file
End user abstraction – start_aCGH.sh • aCGH analysis undertaken by a single shell command • Manages array data input • Collects user specified parameters • Chromosome range • Segmentation algorithms • Significance thresholds • Links condor R job scripting
…. continued … 1 hr – 6 hr later! aCGH region information and plots
Bio HMM Sample percentage Region size DNAcopy Sample percentage Region size Summary findings (38 arrays) • Rapid identification of regions of interest • Easy comparison of aCGH analysis via different algorithms
Sample percentage Region size OSMR Real life application Retrospective analysis confirms initial findings! (summary of 38 samples)
Future development • Tailor output for specific user requirements • Produce overall summary plot • Apply approach to expression arrays
www.bio.cam.ac.uk/~ir210 • Grace Ng • Steph Carter • Konstantina Karagavriliidou • Jenny Barna • Mark Calleja • Nick Coleman