Download
1 / 30
300 likes | 445 Views
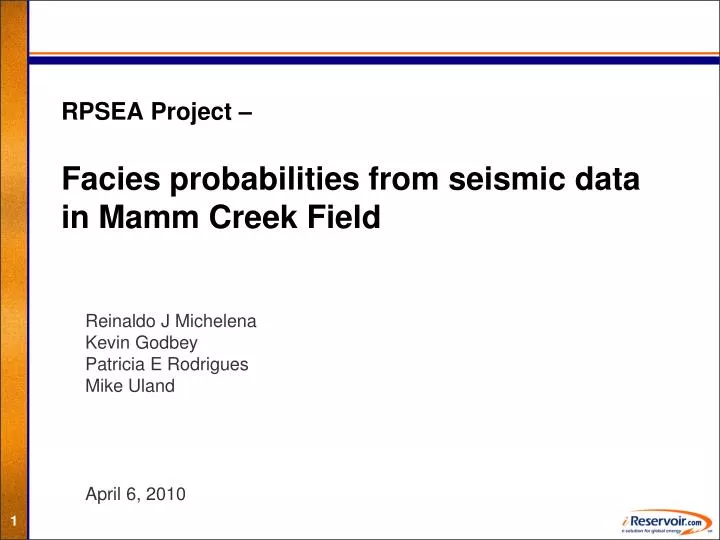
RPSEA Project – Facies probabilities from seismic data in Mamm Creek Field. Reinaldo J Michelena Kevin Godbey Patricia E Rodrigues Mike Uland April 6, 2010. Location of Mamm Creek field. Mamm Creek. Area of interest. Reservoir simulation area. Geological model area.

E N D
RPSEA Project – Facies probabilities from seismic data in Mamm Creek Field Reinaldo J Michelena Kevin Godbey Patricia E Rodrigues Mike Uland April 6, 2010
Location of Mamm Creek field Mamm Creek
Area of interest Reservoir simulation area Geological model area
Stratigraphic column Geological model interval ~2,200 ft Coastal /Alluvial Plain Shoreface/Deltaic Marsh, Mire, Swamp, and Estuarine Marine Shelf/Ramp
Intervals of interest for seismic analysis density log seismic trace Seismic amplitudes Price Coal UMV Lower amplitudes (fluvial) beginning of coal interval MiddleSS Higher amplitudes (transitional and marine) Rollins Cozette Mancos
Reservoir characterization at Mamm Creek MOTIVATION • Effective development of Mamm Creek field requires detailed understanding of all geological features that control gas accumulation and connectivity GOAL • Build geological models that capture the main geological complexities of the field Show how seismic data can be used to help mapping sand distribution in Mamm Creek field this presentation
Challenges from rock physics diagnostics shales RHO Vs sands coals Vp Vp • Potential difficulties: • Sands and shales show significant overlap in log scale crossplots of elastic properties • Presence of thin coal layers may mask “real” seismic response from surroundings sands and shales. RHO Vs
Data inventory • Seismic: • 3D, PP pre-stack, NMO corrected gathers • 3D PS_fast and PS_slow stack volumes (not part of same survey as PP data) • Well: • 102 density logs. Most wells with Gamma Ray, Neutron Porosity and Resistivity • 3 sonic logs • 2 dipole sonic logs (one of them crossdipole) • Formation tops from Bill Barrett Corporation • 8 cores • 12 FMI logs
Summary of seismic workflow • Perform petrophysics/rock physics diagnostics • QC seismic data • Precondition pre-stack gathers for AVO analysis • Interpret PP data • Interpret PS data (consistent with PP interpretation) • Invert PP pre-stack data for Vp, Vs and density • Invert PS stack data for pseudo shear impedance (Zps) • Generate velocity model that honors all marker and horizon information in PP and PS time • Perform time to depth conversion of seismic derived information
Inverted seismic volumes in depth Z RHO Vp Vs high UMV MIddleSS low Zps_fast Zps_slow
Attribute crossplots • Inverted seismic attributes (3 from PP and 2 from PS) can be cross plotted in many different ways • After examining various combinations of these five attributes, we decided to focus only on 6 of such combinations and assess the contribution of each attribute: • Vp vs Vs • Vp vs RHO • Vs vs RHO • Zps_fast vs Zps_slow • Vp vs Vs vs RHO • Vp vs Vs vs RHO vs Zps_fast vs Zps_slow
Seismic attributes at well locations (color = log scale facies) thick sand background RHO Vs Vp Vp RHO Zps slow Vs Zps fast Transitional and marine interval
Log scale attributes (color = lithology) RHO Vs sands Vp Vp RHO Zps slow Vs Zps fast Transitional and marine interval
Seismic attributes at well locations (color = log scale facies) thick sand background RHO Vs Vp Vp RHO Zps slow Vs Zps fast Transitional and marine interval
Probabilities from seismic attribute crossplots Channel No channel
Probabilities extracted at well 14C-20, fluvial 30 wells used for calibration UMV_MKR (4766’MD) TOP_GAS (5306’MD) 100’ MKR1 (6235MD’) Sand Ave 2 2 2 3 5 flags Gamma Lithology Ray Vp, Vs Vp, Rho Vs ,Rho Vp, Vs, Rho Vp, Vs, Rho, 3C
Probability using Vp, Vs, RHO, Zps_fast and Zps_slow 102 wells used for calibration Stratigraphic slice 0 0.6 Thick sand probability
Real vs estimated sand thickness (Vp, Vs, RHO and 3C) Fluvial interval Thickness from seismic data (ft) cc=0. 68 Thickness from log data (ft) Prob cutoff = 0.18 30 wells used to calibrate seismic
Seismic derived probabilities at well locations Probabilities from 5 attribute crossplot calibrated with 102 wells
Thick sand flags and probabilities at well locations Probabilities from 5 attribute crossplot calibrated with 102 wells
Correlation coefficient* per well (marine) Correlation * Real average sand vs Estimated probability Well name Vp, Vs, RHO, 30 calibration wells Vp, Vs, RHO, 102 calibration wells Vp, Vs, RHO, PS, 30 calibration wells Vp, Vs, RHO, PS, 102 calibration wells
Sorted correlation coefficients (marine) Correlation Sort index Vp, Vs, RHO, 30 calibration wells
Sorted correlation coefficients (marine) Correlation Sort index Vp, Vs, RHO, 30 calibration wells Vp, Vs, RHO, 102 calibration wells
Sorted correlation coefficients (marine) Correlation Sort index Vp, Vs, RHO, 30 calibration wells Vp, Vs, RHO, 102 calibration wells Vp, Vs, RHO, PS, 30 calibration wells
Sorted correlation coefficients (marine) Correlation Sort index Vp, Vs, RHO, 30 calibration wells Vp, Vs, RHO, 102 calibration wells Vp, Vs, RHO, PS, 30 calibration wells Vp, Vs, RHO, PS, 102 calibration wells
Sorted correlation coefficients (fluvial) Correlation Sort index Vp, Vs, RHO, 30 calibration wells Vp, Vs, RHO, 102 calibration wells Vp, Vs, RHO, PS, 30 calibration wells Vp, Vs, RHO, PS, 102 calibration wells
Log scale Vs_fast vs Vs_slow (well 41A-28) Log scale Vs_slow (ft/s) Log scale Vs_slow (ft/s) Sand Background Log scale Vs_fast (ft/s) Log scale Vs_fast (ft/s) Fluvial interval Marine interval • Fluvial shales are more azimuthally anisotropic than marine shales • Fluvial sands are less azimuthally anisotropic than marine sands
Conclusions • Facies probability estimation algorithm from multidimensional crossplots of seismic attributes yields useful results even when elastic properties of sandy and background facies overlap completely • When using PP data only, the best results are obtained when using Vp, Vs, and RHO simultaneously • The best separation is achieved when using all five attributes (Vp, Vs, RHO, Zps_fast and Zps_slow) • Sensitivity of PS data to azimuthal anisotropy helps to improve sand identification where sands are more anisotropic than the background
Acknowledgments • The authors acknowledge RPSEA (Research Partnership to Secure Energy for America) for financial support • Thanks also to Bill Barrett Corporation for providing the data used for this study