Download
1 / 48
490 likes | 648 Views
PHOTOTHERMAL SPECTROSCOPY AS A METHOD FOR NONINVASIVE EARLY DETECTION OF CANCEROUS TUMORS. Michal Tepper Under the supervision of Prof. Israel Gannot. Introduction. Spectroscopy of biological tissues is a powerful tool for evaluation of tissue composition and functionality.

E N D
PHOTOTHERMAL SPECTROSCOPY AS A METHOD FOR NONINVASIVE EARLY DETECTION OF CANCEROUS TUMORS Michal Tepper Under the supervision of Prof. Israel Gannot
Introduction • Spectroscopy of biological tissues is a powerful tool for evaluation of tissue composition and functionality. • Photothermal spectroscopy is a method for performing tissue spectroscopy, based on measuring tissue thermal changes due to light excitation.
Previous Photothermal Research • Photothermal spectroscopy was shown to be valuable for surface measurements (Milner, 1998) • Single particles can be detected (Zharov, 2003) • Measurements through fiber bundles are a new field and offer new possibilities
The Method • The temperature increase depends on tissue composition, its optical properties and the exciting laser wavelength. • Using several wavelengths for the excitation will allow us to estimate tissue composition. • The method can be applied to internal cavities using a commercially available endoscope.
The Method LASER TISSUE OPTICAL FIBER THERMAL CAMERA COHERENT WAVEGUIDE BUNDLE ENDOSCOPE
The Goal • One promising application is the determination of the oxygenation of a tissue, a widely researched subject due to its clinical importance: • Tumor detection (90% of human cancers arise from epithelial cells) • Cancer treatment adjustment • Hypoxia detection
Research Stages • Creating a theoretical model • Developing an algorithm suitable for different types of tissue • Tissue-like-phantoms experiments • Tissue engineered phantoms experiments • In-vivo experiments WE ARE HERE
The Theoretical Model • Simulatingtemperature rise in the tissue as a result of laser illumination: Defining material concentration (water, melanin, hemoglobin) Calculating optical properties of the tissue’s layers Calculating absorption using MCML Calculating tissue temperature distribution using COMSOL Calculating the thermal image seen by the camera
Skin Tissue Model A seven layer skin tissue model was selected.
ResultsMonte-Carlo J/cm3 z [cm] Baseline absorption Hemoglobin absorption in dermis Melanin absorption in epidermis r [cm] Illumination
ResultsCOMSOL T [K] r [cm] z [cm]
Thermal Image Simulation T [K] y [cm] x [cm]
Preliminary Results • Selection of excitation wavelengths: T [K] T [K] 25% melanin 15% melanin 5% melanin Wavelength [nm] Wavelength [nm] saturation evaluation is limited by skin color
Limitations • Solving the equation system is inaccurate because of measurement errors. • The model might be inaccurate and parameters might change between people and between different locations. We want to develop a generic algorithm suitable for different tissues and wavelengths.
Intuition • Examining the shape of the temperature function and not the values. µa T [K] Wavelength [nm] Wavelength [nm]
The Solution • The measured temperature is a function of several unknowns, including the saturation. • The unknowns can be estimated using a simple curve fitting algorithm. • The curve fitting algorithm depends on the initial guess for each of the unknowns. Therefore, an initial guess algorithm for the saturation was also developed.
Temperature Function A1=Σ µi·ci Effective absorption of layer 1 T1=f1()A1 T2=f2(A1 ,)A2 T3=f3(A1 , A2 ,)A3 The absorption of each layer is affected by the absorption of upper layers
Temperature Function • The temperature rise is the sum of effective contributions of all the layers: • Each layer affects deeper layers: • The functions fi can be approximated using Taylor approximation:
Temperature Function • Comparing computational results to the theoretical equations enables us to estimate some of the coefficients:
Temperature Function • For skin tissue (containing melanin): • For “internal” tissue (skin tissue without melanin):
Results • Results of the initial guess algorithm for skin tissue with 7.5-10% melanin: Estimated saturation True saturation
Results • Results of the saturation estimation algorithm for the tissue: Estimated saturation True saturation
Results • The results of the algorithm demonstrated considerable agreement with the model’s actual oxygenation values. • RMS of the error is reasonable.
Results • Results of the initial guess algorithm for skin tissue without melanin, representing internal tissue: Estimated saturation True saturation
Results • Results of the saturation estimation algorithm the tissue: Estimated saturation True saturation
Results • Results for skin tissue without melanin. • RMS of the error is relatively small.
Experimental Setup • The phantoms were created using various types of absorbers.
Experimental Setup • The agar used in the phantoms simulates the thermal properties of the skin.
Absorption spectra • The selected absorbers were MethyleneBlue, IndocyanineGreen (ICG) and ink.
Experimental Setup • The phantoms are excited by 3900s tunable laser, pumped by Millenia Vs Laser.
Experimental Setup • The relative intensity of the illumination is measured using an integration sphere.
Experimental Setup • The temperature is measured by thermoVision A40 IR camera. • The experiments can be monitored using MicroMax CCD camera.
Experimental Setup • The setup can be further simplified by using diodes and thermocouples.
Temperature measurement Max temperature not reached Noisy measurements Calibration drift
Temperature measurement • The temperature is estimated using a curve fitting algorithm. Tsat T0
Intensity Calibration • Calculated using measurements with the integration sphere
Calibrated Measurement Results • Temperature increase, normalized according to intensity
Estimated temperature function a1, a2 and S are unknowns and will be estimated using the curve fitting algorithm. a1 and a2 are a function of the materials thermal and physical properties and concentrations. S is the saturation. (ratio between ICG and Methylene Blue)
Experimental Stages • Preliminary measurements: Used to fine-tune experimental procedures and algorithms and to adjust material concentrations. • Repeating measurements with a larger number of phantoms • Validating the algorithms
Results • Preliminary measurements: Five agar models containing two materials. • For each sample there are 5 measurements and 3 unknowns.
Results • The adjusted procedures were used to measure 11 phantoms.
Results • Preliminary measurements of phantoms with upper absorbing layer (simulating the epidermal layer).
Future Research • Layered agar phantoms with increasing complexity • Adjusting the algorithms • Tissue engineered phantoms • Fiber bundle experiments • In-vivo experiments • Collaboration with Rabin Medical Center
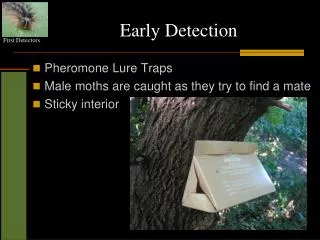
900 fibers HGW Fiber Bundle Experiments • Infrared imaging bundles can be used to detect tumors in internal organs. • The bundles can be integrated to a commercially available endoscope.
Fiber Bundle Experiments • A preliminary experiment with 1mm fiber bundle was performed on an agar model. • The measured signal is clearly reduced • Results are satisfying for a first experiment: Reference value: 100%