Download
1 / 9
110 likes | 179 Views
Learn how to write equations in point-slope form to model real-world data. Understand when to use point-slope form and how it differs from slope-intercept form. Practice applying the point-slope formula to find equations using given slope and points. Explore population growth and experimental data scenarios.

E N D
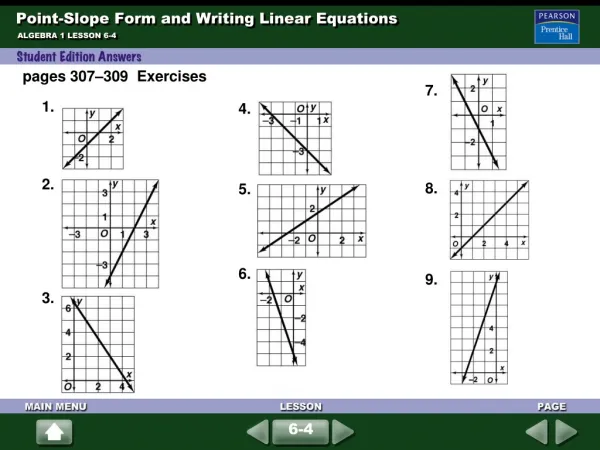
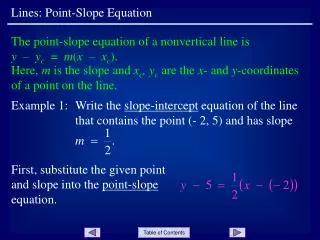
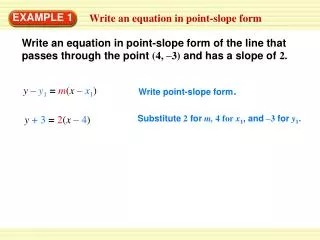
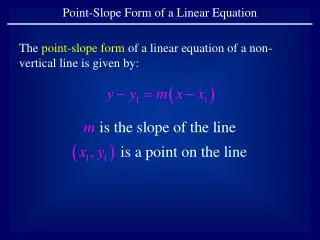
Point-Slope Form of a Linear Equation Learn the point-slope form of an equation of a line Write equations in point-slope form that model real-world data
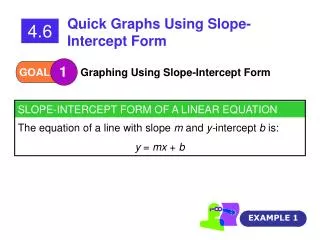
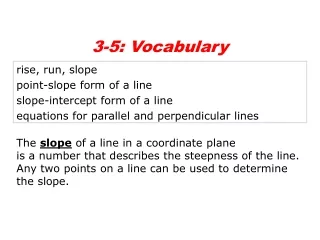
You have been writing equations of the form y = a + bx. When you know the line’s slope and the y-intercept you can write its equation directly in intercept form. • But there are times that we don’t know the y-intercept. • Some homework questions had you work backwards from a point using the slope until you found the y-intercept. • We can use the slope formula to generate the equation of a line from knowing the slope and one point on the line.
Since the time Beth was born, the population of her town has increased at the rate of approximately 850 people per year. • On Beth’s 9th birthday the total population was nearly 307,650. If this rate of growth continues, what will be the population on Beth’s 16th birthday?
Silo and Jenny conducted an experiment in which Jenny walked at a constant rate. Unfortunately, Silo recorded on the data shown in the table.
Silo and Jenny conducted an experiment in which Jenny walked at a constant rate. Unfortunately, Silo recorded only the data shown in the table.
Complete steps 1-5 with your group. Be prepared to share your thinking with the class.
Consider a new set of data that describe how the temperature of a pot of water changed over time as it was heated. • Some of the group should create a paper graph while others use their graphing calculator to create a scatter plot. • Complete steps 6-8 with your group.
For step 9, compare your graph to others in your group. Does one graph show a line that is a better fit than others. Explain.
When do you use slope-intercept form and when do you use point-slope form? • Is there a difference between the two? • Explain how the two forms are similar and how they are different.