Download

1 / 30
300 likes | 314 Views
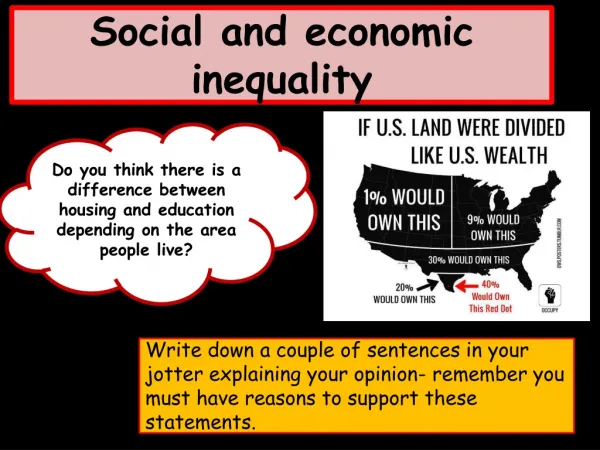
This article explores the economic inequality and wealth distribution in Canada and the United States, using data on income distribution and the Lorenz curve. It also discusses the impact of economic events on the distribution of wealth, such as the housing market crash. Additionally, it examines the reasons why professionals are paid more than salespeople and the factors influencing employment in managerial and professional positions.

E N D
20 Economic Inequality CHECKPOINTS
Checkpoint 20.1 Checkpoint 20.2 Checkpoint 20.3 Problem 1 Problem 1 Problem 1 Clicker version Problem 2 Problem 2 Clicker version Problem 2 Problem 3 In the news In the news In the news
Practice Problem 1 The table shows the distribution of income in Canada. Create a table that shows the cumulative percentages of households and income in Canada. CHECKPOINT 20.1
Solution Table 2 shows the cumulative percentages of households and income. CHECKPOINT 20.1
Practice Problem 2 Table 1 shows the distribution of income in Canada and The table below shows the distribution of income in the United States. Draw the Lorenz curves for Canada and the United States. Compare the distribution of income in Canada with that in the United States. Which distribution is more unequal? CHECKPOINT 20.1
Solution A Lorenz curve plots the cumulative percentage of income against the cumulative percentage of households. The blue curve plots the data for the Canadian Lorenz curve. The green curve plots the data for the U.S. Lorenz curve. CHECKPOINT 20.1
The line of equality shows an equal distribution. The Canadian Lorenz curve lies closer to the line of equality than the U.S. Lorenz curve, so the distribution of income in the United States is more unequal than that in Canada. CHECKPOINT 20.1
In the news Minorities hit harder by economic issues Plummeting home values, as well as home foreclosures, have had a big impact on the distribution of wealth because blacks and Hispanics have a much higher share of their wealth tied up in the value of their homes. Hispanics experienced the biggest loss of wealth because many bought homes in states where the real estate market had the steepest plunge in value. Source: USA Today, September 14, 2007 Explain how the events in the new clip changed the distribution of wealth. Which quintiles would experience an increase in their share of wealth? CHECKPOINT 20.1
Solution A household’s wealth is the value of the things it owns at a point in time. It is measured as the market value of a household’s home, the stocks and bonds that it owns, and the money in its bank accounts minus its debts. Because most of the wealth of blacks and Hispanics is made up of their houses, as house prices fell and home foreclosures increased, the percentage of total wealth of the lowest quintiles fell and the percentage of total wealth held by wealthier quintiles increased. The distribution of wealth became more unequal. CHECKPOINT 20.1
Practice Problem 1 In the United States in 2010, 30 million people had full-time managerial and professional jobs that paid an average of $1,200 a week. At the same time, 10 million people had full-time sales positions that paid an average of $600 a week. Explain why managers and professionals are paid more than salespeople. CHECKPOINT 20.2
Solution A typical manager or professional has incurred a higher cost of education and on-the-job training than the typical salesperson has. The supply curve of managers and professionals, SH, lies above that of salespeople, SL. CHECKPOINT 20.2
The better education and more on-the-job training result in managers and professionals having more human capital and a higher value of marginal product than that of a salesperson. The demand curve for managers and professionals, DH, is greater than the demand for salespeople, DL. CHECKPOINT 20.2
The figure shows that the combination of demand and supply leads to a higher wage rate for managers and professionals than for salespeople. CHECKPOINT 20.2
CHECKPOINT 20.2 Study Plan ProblemIn 2010, 30 million professionals were paid an average of $1,200 a week and 10 million salespeople were paid an average of $530 a week. Professionals are paid more than salespeople because ______. • Professionals have a higher value of marginal product • Both the supply of professionals and the demand for professionals are greater than for salespeople • Professionals have more human capital • Professionals incur a higher cost of education • All of the above.
Practice Problem 2 In the United States in 2010, 30 million people had full-time managerial and professional jobs that paid an average of $1,200 a week. At the same time, 10 million people had full-time sales positions that paid an average of $600 a week. Explain why, despite the higher weekly wage rate, more people are employed as managers and professionals than as salespeople. CHECKPOINT 20.2
Solution The figure shows that the combination of greater demand and greater supply leads to greater employment for managers and professionals than for salespeople. CHECKPOINT 20.2
Practice Problem 3 In the United States in 2010, 30 million people had full-time managerial and professional jobs that paid an average of $1,200 a week. At the same time, 10 million people had full-time sales positions that paid an average of $600 a week. Shopping online has become popular and more and more firms offer their goods and services for sale online. If this trend continues, how do you think the market for salespeople will change in coming years? CHECKPOINT 20.2
Solution As shopping online continues to grow, firms will hire fewer salespeople. The demand for salespeople will decrease, and fewer people will work in sales. What will happen to their wage rate will depend on how the supply of salespeople changes. CHECKPOINT 20.2
Study Plan ProblemIn 2010, 30 million professionals were paid an average of $1,200 a week and 10 million salespeople were paid an average of $600 a week. Shopping online has become popular. If this trend continues, the ______ salespeople will ____ and the wage rate will ___. CHECKPOINT 20.2 • demand for; decrease; definitely fall • demand for; decrease; might rise or fall • supply of and demand for; decrease; definitely rise • demand; decrease; will remain relatively unchanged
In the news Trade schools boom with enrollees of all ages Disappearing jobs have helped drive thousands of people to state-run trade schools, where they can receive training on anything from truck driving to medical billing. Patricia Parker, 58, said, “I'm tired of getting laid off at factories. I need to re-educate myself.” She expects to have finished coursework in business system technology and get a job at a medical office. Some students are retraining as auto mechanics, a skill that won’t be outsourced. Source: USA Today, July 19, 2009 Why might people who previously worked in factories be going to trade school? CHECKPOINT 20.2
Solution Factory jobs are disappearing as factories (such as those making furniture and textiles) close or jobs are outsourced. Patricia Parker is acquiring a skill which she believes will not be outsourced and one that she might be able to use in many different jobs. Other students think that a mechanic’s skill might serve them well in the future. CHECKPOINT 20.2
Practice Problem 1 Table 1 shows the distribution of market income. Table 2 shows the redistribution of income through income taxes and benefits. Calculate the income shares of each 20 percent of households after tax and redistribution. CHECKPOINT 20.3
Solution To find the distribution of income, multiply the market incomes by the tax rates, subtract the taxes paid, and add the benefits received to obtain the income after tax and benefits. The table shows the calculations. CHECKPOINT 20.3
Practice Problem 2 Table 1 shows the distribution of market income. Table 2 shows the redistribution through income taxes and benefits. Draw the Lorenz curve before and after redistribution. CHECKPOINT 20.3
Solution To draw the Lorenz curves, calculate the cumulative shares. For example, before taxes and benefits, the lowest 20 percent have 5 percent of total income and the lowest 40 percent have 15 percent (5 + 10) of total income. CHECKPOINT 20.3
After taxes and benefits, the lowest 20 percent have 16 percent of total income and the lowest 40 percent have 34.1 percent (16 +18.1) of total income. CHECKPOINT 20.3
The figure shows the Lorenz curves before taxes and benefits (green curve) and the Lorenz curve after taxes and benefits (blue curve). CHECKPOINT 20.3
In the news The 0% tax rate solution In 2006, the bottom 40 percent of income earners received net payments equal to 3.6% of total income tax revenues. The middle 20 percent of income earners pay 4.4% of total income tax revenues. That means the bottom 60 percent together pay less than 1% of income tax revenues. Source: The Wall Street Journal, July 14, 2009 Would a policy that taxed the bottom 60 percent of income earners at a 0% tax rate and reduced redistribution by 1 percent of tax revenue have any merit? CHECKPOINT 20.3
Solution The redistribution process uses resources. A dollar taken from a high income earner does not translate into a dollar for a low-income earner. Reducing the necessity of 60 percent of workers to file income tax will save resources. There would be a net social gain, which might be used to help the poor. CHECKPOINT 20.3