Download
1 / 4
40 likes | 62 Views
Explore diurnal variations of summer precipitation over China from 1991-2004, showing phase and amplitude changes. Regions like Yangtze River and Yellow River emphasize unique patterns. Hovmöller diagrams illustrate hourly precipitation percentages in different zones. Research by Yu, R., T. Zhou, A. Xiong, Y. Zhu, and J. Li (2007), Geophys. Res. Lett., 34, L01704. doi: 10.1029/2006GL028129.

E N D
Yu, R., T. Zhou, A. Xiong, Y. Zhu, and J. Li (2007), Diurnal variations of summer precipitation over contiguous China, Geophys. Res. Lett.,34, L01704, doi:10.1029/2006GL028129.
Figure 1. Spatial distributions of the phase and amplitude (normalized by the daily mean) of the 1991-2004 mean diurnal cycle of summer (June–August) hourly precipitation. Colors represent the normalized amplitude (i.e. in unit of daily mean) while unit vectors denote the local solar time (LST) of the maximum precipitation (phase clock). The solid grey line shows the 3000 m elevation contour line. The locations of the Yangtze River and Yellow River are drawn as orange lines. Five distinct regions are also labeled.
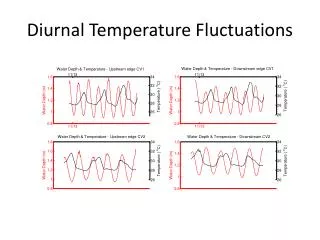
Figure 2. Diurnal variations of the 1991-2004 mean summer precipitation averaged over the five regions marked in Fig. 1. The horizontal axis corresponds to the local solar time and the units of vertical axis are mm/hour.
Figure 3. Hovmöller diagrams of mean diurnal variationsin hourly precipitation percentage relative to the daily total rainfall amount (in unit of %). (a) Time-longitude cross section for the 27-29N zone, (b) Time-latitude cross section averaged over the 110-130E. The vertical axis is local solar time in hours.