
Graphing Rational Functions - Comparing and Evaluating
Learn how to graph and compare rational functions using examples and step-by-step solutions. Also, determine the domain and range of the functions.

Graphing Rational Functions - Comparing and Evaluating
E N D
Presentation Transcript
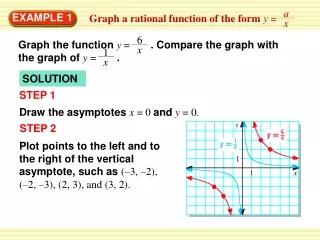
a Graph a rational function of the form y = x 6 Graph the function y = . Compare the graph with the graph of y = . x 1 x EXAMPLE 1 SOLUTION STEP 1 Draw the asymptotes x = 0 andy = 0. STEP 2 Plot points to the left and to the right of the vertical asymptote, such as (–3, –2), (–2, –3), (2, 3), and (3, 2).
a Graph a rational function of the form y = x 6 x 1 x The graph of y =lies farther from the axes than the graph of y =. EXAMPLE 1 STEP 3 Draw the branches of the hyperbola so that they pass through the plotted points and approach the asymptotes. Both graphs lie in the first and third quadrants and have the same asymptotes, domain, and range.
a +k Graph a rational function of the form y = x–h – 4 Graph y = –1. State the domain and range. x +2 Plot points to the left of the vertical asymptote, such as (–3, 3) and (– 4, 1), and points to the right, such as (–1, –5) and (0, –3). EXAMPLE 2 SOLUTION STEP 1 Draw the asymptotes x = –2 and y = –1. STEP 2
a +k Graph a rational function of the form y = x–h EXAMPLE 2 STEP 3 Draw the two branches of the hyperbola so that they pass through the plotted points and approach the asymptotes. The domain is all real numbers except – 2, and the range is all real numbers except – 1.
– 4 1. f (x) = x domain: all real numbers except 0, range: all real numbers except 0. ANSWER for Examples 1 and 2 GUIDED PRACTICE Graph the function. State the domain and range. SOLUTION
–5 2. y = domain: all real numbers except 0, range: all real numbers except – 5. ANSWER 8 x for Examples 1 and 2 GUIDED PRACTICE Graph the function. State the domain and range. SOLUTION
3. y = +2 1 x – 3 domain: all real numbers except 3, range: all real numbers except 2. ANSWER for Examples 1 and 2 GUIDED PRACTICE Graph the function. State the domain and range. SOLUTION


