Download

1 / 29
290 likes | 315 Views
The alliance of states, including Arkansas, Colorado, Connecticut, and others, is committed to transforming higher education with Guided Pathways to Success. Statewide initiatives like Corequisite Remediation and Performance Funding aim to increase on-time graduation rates and reduce excess credits. Contrary to the "Four-Year Myth," data shows faster graduation is possible. Structured programs and academic maps provided through GPS offer clear pathways to graduation, reducing indecision with informed default choices. By aligning math to majors and providing intrusive advising, students are guided towards successful degree completion in less time and with less debt.

E N D
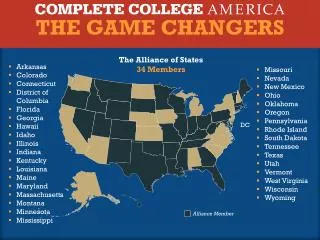
COMPLETE COLLEGE AMERICA The Alliance of States 35 Members • Arkansas • Colorado • Connecticut • District of Columbia • Florida • Georgia • Hawaii • Idaho • Illinois • Indiana • Kentucky • Louisiana • Maine • Maryland • Massachusetts • Montana • Minnesota • Mississippi • Missouri • Commonwealth of the Northern Mariana Islands • Nevada • New Mexico • Ohio • Oklahoma • Oregon • Pennsylvania • Rhode Island • South Dakota • Tennessee • Texas • Utah • Vermont • West Virginia • Wisconsin • Wyoming DC Alliance Member
Guided Pathways to Success DC GPS at Scale States GPS in STEM States
Fifteen to Finish DC Statewide Initiatives States with Campus-Based Initiatives
Corequisite Remediation State Activity DC White House Summit States Committed to Transform Remediation States Committed to Scale Coreq by 2015
Performance Funding DC Under Development Implemented in At Least One Sector
Metrics and Data DC State & Institutional Data Reported Some Data Reported
Four-Year MYTH
The vast majority of American college students do not graduate on time … but many more can – saving themselves and their families precious time and money. Four-Year Myth
On-Time Graduation Rates (Full-Time Students) 2-Year Associate 4-Year Bachelor’s 4-Year Bachelor’s (non-flagship) (flagship/ very high research) 5% 19% 36% ON TIME ON TIME ON TIME Four-Year Myth
150% Graduation Rates (Full-Time Students) 2-Year Associate 4-Year Bachelor’s 4-Year Bachelor’s (non-flagship) (flagship/ very high research) 13% 43% 68% IN 3 YEARS IN 6 YEARS IN 6 YEARS Four-Year Myth
50 of 580+ public four-year institutions report on-time graduation rates above 50% Four-Year Myth
Excess Credits (Full-Time Students) 2-Year Associate 4-Year Bachelor’s 4-Year Bachelor’s (non-flagship) (flagship/ very high research) 80.9 134.6 133.5 60 Credits Standard 120 Credits Standard 120 Credits Standard Four-Year Myth
Time to Degree (Full-Time Students) 2-Year Associate 4-Year Bachelor’s 4-Year Bachelor’s (non-flagship) (flagship/ very high research) 4.9 4.4 3.6 4 Years Standard 4 Years Standard 2 Years Standard 120 Credits Standard Four-Year Myth
Average Estimated Undergraduate Budget, 2013-2014 (Full-Time Students) $1,270 2-Year Commuter books and supplies $3,264 $7,466 $2,225 room and board tuition and fees other expenses $1,708 $15,933 transportation Source: fly.temple.edu and utexas.edu/enrollment-management/messages/ut-strives-improve-four-year-graduation-rates Four-Year Myth
Average Estimated Undergraduate Budget, 2013-2014 (Full-Time Students) $2,105 other expenses $1,207 4-Year In-State books and supplies $8,893 $9,498 room and board tuition and fees $1,123 $22,826 transportation Source: fly.temple.edu and utexas.edu/enrollment-management/messages/ut-strives-improve-four-year-graduation-rates Four-Year Myth
Total Cost of Each Extra Year (Full-Time Students) 2-Year Student 4-Year Student $22,826 $15,933 in cost of attendance in cost of attendance $45,327 $35,000 in lost wages in lost wages $50,933 $68,153 Source: fly.temple.edu and utexas.edu/enrollment-management/messages/ut-strives-improve-four-year-graduation-rates Four-Year Myth
Cumulative Debt Upon Graduation $19,000 $32,000 $20,000 $35,000 In 6 Years On Time In 6 Years On Time TEMPLE UNIVERSITY UT-AUSTIN Source: fly.temple.edu and utexas.edu/enrollment-management/messages/ut-strives-improve-four-year-graduation-rates Four-Year Myth
NO CLEAR PATH TO GRADUATION
Too much choice – especially uninformed choice – leads to indecision or poor decisions.
Most people accept – even welcome – a default choice designed by informed professionals.
New Model Structured Programs An academic semester-by-semester plan: a clear path to graduation. [Nursing] [Honors] [Engineering]
Students don’t “discover” the right path; after choosing a major, the academic map is the default schedule.
The Essential Elements of GPS Informed Choice and Meta Majors Default Pathways Math Aligned to Majors Critical Path Courses Academic Maps Intrusive Advising