Download
1 / 25
250 likes | 271 Views
Dive into quantitative observational data methods, analysis, and scientific communication. Learn measurement quality, sensors, and report writing. Grading based on lab work, reports, and quizzes.

E N D
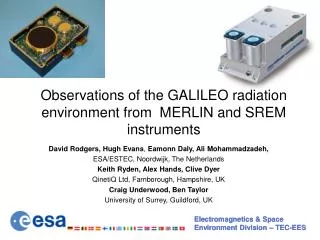
ATMS 451: Instruments and Observations MWF 11:30 AM – 12:20 PM 310c ATG TuTh 10:30 AM – 12:20 PM 108 (be prepared for changes)
Instructors Joel Thornton Assoc. Professor, Atmospheric Sciences 508 ATG thornton@atmos.uw.edu Robert Wood Assoc. Professor, Atmospheric Sciences 718 ATG robwood@atmos.uw.edu
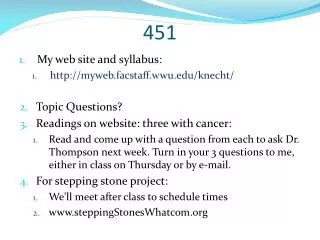
Course Materials and Logistics • No required textbook (I can suggest some) • Course materials on website http://www.atmos.washington.edu/~robwood/teaching/451/ • Buy a laboratory notebook from UBS • Form groups of 3-4 by Wednesday for lab work • Determine if you can host a weather station
Purpose of this Course • Enable you to appreciate the relevance of good, quantitative observational data • Allow you to experience how such information is obtained, analyzed, and expressedin scientific and technical communications
Topics and Related Activities 1. Analyzing and Quantifying Measurement Quality 2. Practicalities of Making Measurements 3. Concepts and Realities of Common Sensors 4. Scientific Communication: Report Writing
Grading • 75% of final grade based on laboratory/analysis work • 60% based on 2 formal written reports (thermometry and weather station) • 30% on analysis “worksheets” • 10% on quality of laboratory notebook • 25% on ~ weekly quizzes based on lecture material • NOTE: You are expected to have ~7 weeks of data for the weather stations. Every week of data that is missing is a 10% deduction from your weather report grade.
Relevance to Past and Future Work • Basic Science: • a connected body of agreed upon truths based on OBSERVABLE facts, classified into laws (theories) Observation ?Uncertainty? Hypothesis Experimental Test (measure) ?Uncertainty?
Gravitational Lensing – Einstein Rings D.E.D 1919 – measured bend angle by sun: 2 +/- 0.3”
Relevance to Past and Future Work 2. Applied Science/Engineering
Price of Gold A treasure hunter is hawking a 1 kg royal crown she has found, claiming it is solid gold. Your assistant measures its density to be 15 +/- 1.5 g/cm3. The density of pure gold is 15.5 g/cm3. The price of gold is currently $51,500 per kg. What do you do?
Measurement Uncertainty Issues • For multiple measurements of the same quantity, what exactly is the “best estimate” of the true value? • X x x implies a range within which we are “confident ” the true value exists • How do we determine the value of x?
Avoid Significant (Figure) Embarrassment After a series of measurements and calculations you determine the acceleration due to gravity on Earth. The answer on your calculator/computer is: g = 9.82174 m/s2, and the uncertainty estimate is 0.02847 m/s2. How do you report your result?
Measurement • determination of size, amount, or degree of some object or property by comparison to a standard unit
Measurements are meant to be compared • Comparisons (two measurements or measurement vs predictions) come down to a range over which we are “confident” about our conclusions • Often, measurements are just the starting point, and some property calculated from the measurements is the point of comparison: must understand how “confidence” in measurements propagate through the calculations • It is as important to know how the estimate of confidence in the measurement is made, as it is to be given a numerical value: give clear descriptions of your approach to uncertainty analysis
Uncertainty • An indefiniteness in measurements of a system property, and any quantities derived from them, due to sensor limitations, problems of definition, and natural fluctuations due to the system itself. • All measurements carry uncertainty, often called “errors” – NOT a mistake, cannot be avoided! • Error = Uncertainty (for us) – cannot be known exactly, only estimated, must explain basis of estimation
Sources of Measurement Uncertainty Sampling Analytical
Define “precision” and its relationship to “accuracy”
Distribution of N Measurements and of Means x = x/10 N = 10;blue N = 10 performed many times, distribution of means; black x
Normal Error Integral 95.4% w/in 2 68% w/in 1 P(t) t
Question Two different weathernuts living in adjacent towns (town A and B) measure the air temperature in their respective town during a brief period. Both want to claim their town was colder than the other during this time. Does either one have a valid claim? Town A T Measurements: 10.2, 11.5, 13.4, 15.1, 12.2 oC Town B T Measurements: 9.8, 10.2, 12.8, 14.6, 11.7 oC The uncertainty in any one of weathernut A’s or weathernut B’s individual measurements = 0.5 oC.