Download
1 / 1
10 likes | 90 Views
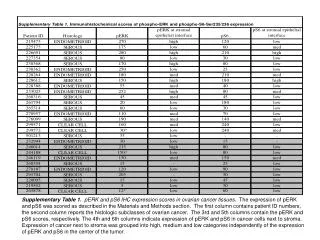
Supplementary Table 1 presents pERK and pS6 expression scores in ovarian cancer tissues, categorized into high, medium, and low groups based on cancer cells adjacent to stroma. Patient IDs, histologic subclasses, and scoring details are included.

E N D
Supplementary Table 1.pERK and pS6 IHC expression scores in ovarian cancer tissues. The expression of pERK and pS6 was scored as described in the Materials and Methods section. The first column contains patient ID numbers, the second column reports the histologic subclasses of ovarian cancer. The 3rd and 5th columns contain the pERK and pS6 scores, respectively. The 4th and 6th columns indicate expression of pERK and pS6 in cancer cells next to stroma. Expression of cancer next to stroma was grouped into high, medium and low categories independently of the expression of pERK and pS6 in the center of the tumor.