Download
1 / 40
400 likes | 502 Views
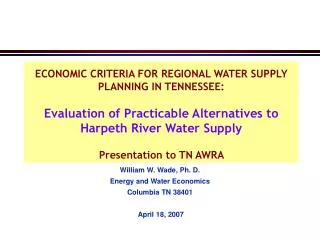
IRP Approach to Water Supply Alternatives for Duck River Watershed: Presentation to XII TN Water Resources Symposium. William W. Wade Energy and Water Economics Columbia, TN April 4, 2002. Overview. 1 Duck River Reliability Planning 2 Demand Forecasts

E N D
IRP Approach to Water Supply Alternatives for Duck River Watershed:Presentation to XII TN Water Resources Symposium William W. Wade Energy and Water Economics Columbia, TN April 4, 2002
Overview 1 Duck River Reliability Planning 2 Demand Forecasts 3 Effects on Duck River Flows 4 Supply Planning 5 Hydrology Implications 6 Alternative Evaluation 7 Reliability Analysis 8 Decision Issues
Duck River Reliability Planning (1) Two questions drive TVA Duck River Needs Analysis: 1. How much added water does the region need? 2. When will it be needed? Don’t address the more fundamental questions . . .
Duck River Reliability Planning (2) Five Better Questions for Duck River Needs Analysis: 1. What is existing reliability & what does region need? 2. What can the region afford? 3. When needed and what is the least cost way of meeting future needs? 4. How do alternatives relate to other needs in the watershed? 5. Do alternatives add benefits other than supply reliability? • Can these benefits absorb some costs?
Integrated Resource Planning • Supply reliability measures a water system’s expected success in avoiding detrimental economic, social, and environmental effects from water shortages. • Effects, not shortage per se, are the targets. • Supply reliability planning entails a water management strategy that provides the watershed with a reliable and affordable water supply for the next 50 years. • Reliability is an economic outcome of the process.
Reliability Targets Reliability planning begins with Objectives • DRA reliability targets: 1. Maintain Normandy above 864 elevation. [or ?] 2. Meet 120/155 cfs at Shelbyville + 10 cfs demand. 3. Avoid breaching 130 cfs flow benchmark at Columbia more than 1 day every five years. [or ?] 4. Meet consumptive demands in the watershed.
Reliability Targets (2) • DRA must set its own reliability targets before evaluating resource options. • Cost effects of less than 100% supply reliability of any target need to be compared to cost of achieving target.
Water Demand Forecast Demand forecast initiates water needs assessment. • Average daily demand - beginning point for water needs analytics. USGS demand forecast updated based on revised population. • Table 1 shows revised water demands increased by population growth ratios. • Based on input from USGS (Susan Hutson)
Peak Water Demand Forecast Water supplies must meet peak needs. Chart 1 shows that peaks occur July - Sept. Withdrawal demands in the spring are about 65% of peak demands. Planning to meet demands amounts to planning for growth to meet peak. • Key is peak month.
Peak Water Demand Forecast (2) Table 2 shows requirements to meet peak monthly requirements. • Except DRUC: USGS predicts peak day demand.
Effects on Duck River Flows Can the Duck supply future water demands? Table 3 begins to answer the question.
Effects on Duck River (2) Providing high quality drinking water under conditions of drought and peak demand is difficult and expensive. Chart 2 shows that DRUC’s target operating range between 865 - 875 elevation. • Making drinkable water from Normandy is difficult . . . Modeling shows that 20 mgd peak demand would bring the reservoir down to 858 feet in drought. Treatment costs for DRUC to achieve drinking water quality for peak summer months and meet S’ ville flow targets are part of the needed data.
Planning Criteria Assume that DRUC can meet Coffee County demands at reasonable costs while TVA meets Shelbyville flow target. Can flows in the river meet future demands and TDEC requirement that flows exceed 130 cfs at river mile 133?
Supply Planning Results USGS flows at Columbia since 1904 can be used for statistical analysis. But, flows before the river was regulated with opening of Normandy, January 1976, don’t directly apply. Flows at Columbia since closure are used to compare supplies to requirements.
Supply Planning Results (2) Water supply shortfalls are measured in terms of: • Frequency • Duration • Magnitude Hydrologic data post closure are “run” past future demands to determine frequency, duration and magnitude of breach to 130 cfs minimum flow.
Supply Planning Results (3) Two scenarios are assumed: • USGS demand forecast -- Revised by EWE. • Extraordinary industrial growth upstream of Columbia withdrawing 12.5 cfs. (Four 2 MGD plants, one in each county.) 2050 demands are considered as Low or High. Table 4 shows the equivalent benchmark minimum flows that will meet demands and minimum flow criteria.
Supply Planning Results (4) Results show that a shortage could occur 68 % of the years, rising to 89 % of the by 2050. Average shortfalls would rise from 15 - 22 cfs over time and scenario; 27 cfs with higher industrial growth. Annual Shortfall days would rise from 9 to 34 within a year; 45 days with higher industrial growth. Added supply of 1,234 AF would eliminate expected shortfall.
Supply Planning Results (5) A storage solution must target the maximum likely shortage event. • Table 6 shows this to range from 228 to 1,087 million gallons. [700 - 3,337 AF.] • Chart 5 interpolates the estimates to show the growth in this requirement. • Chance of one year in 21 of 700 AF shortfall rising to 2,450 AF by 2050.
Hydrology Implications Protecting the Columbia benchmark, 130 cfs, will require new water supply. • Protecting the 21-year drought of record requires 700 - 1,250 AF to meet 2020 low to high demands. • Protecting the 21-year drought of record requires 2,450 AF to meet high demand for a 37-day 2050 drought.
Hydrology Implications (2) • Final conclusions about new water supply require hydrology study including historic droughts before Normandy closure; i. e., with synthetic data. • Synthetic data would simulate the Duck River flows post closure to show how the managed river would operate with Normandy. • Provide a longer statistical basis for conclusions.
Alternatives Evaluation • Challenge is to find the most economic mix of resources to achieve an acceptable supply reliability objective. • An affordable alternative with acceptable risk is preferable to elimination of any chance of shortage at much higher costs. • Depends on cost of effects of shortage.
Alternatives Evaluation (2) • Policy determinants of the best mix are DRA’s four reliability targets: • Reliability of Normandy water levels. • Reliability of flow rate at Shelbyville. • Reliability of flow rates past Columbia. • Reliability of watershed demand coverage. • What risk of shortfall is acceptable? • 50 years demand forecast is a long time with considerable uncertainty. • Planning for the high forecast may be too risk averse, or it may be prudent.
Alternatives Evaluation (3) • Empirical determinants of the best mix are hydrologic, economic and regulatory driven. • What added supply do you need to achieve acceptable reliability? • What can you pay for? • What can you permit? • TVA 1998 and 2000 reports were not intended to and did not answer these questions.
Alternatives Evaluation (4) TVA Alternatives: (All costs approximate) • Raise Normandy Dam $ 8 million • Downstream Intake $11 million • Tims Ford Pipeline $13 million • Fountain Creek Reservoir $50 million Added Alternatives: • Shift Tullahoma Demand to Tims Ford $? • Conservation $ 1 million
Alternatives Evaluation (5) Water Supply Created by Alternatives: 2050 Conservation 2,160 AF in Normandy Move Tullahoma Demand 4,000 AF in Normandy Tims Ford Pipeline 22 cfs when needed Raise Normandy 17,000 AF in Normandy Raise Normandy+Shift Tullahoma 21,000 AF Fountain Creek Reservoir 44,000 AF in Fountain Creek
Reliability Analysis • Table 7 compares the needed supplies and added water. • Worst case requirements are shown in top of Table 7. • New supplies in storage are shown on bottom.
Reliability Analysis (2) Hydrologic modeling reveals likelihood, duration of shortages, average and worst case amounts of needed new water. • About 15 cfs, 7 days duration, 2 year in 3: 2020. • About 22 cfs, 8 days duration, 4 years in 5: 2050. • Max shortage event: • About 16 cfs, 27 days duration, 1 year in 21: 2020 • About 22 cfs, 37 days duration, 1 year in 21: 2050
Summary of Decision Issues • Four reliability targets govern the selection of a resource mix. • Maintain Normandy above 864 elevation. [or ?] • Meet 120/155 cfs at Shelbyville. [treatment determined] • Avoid breaching 130 cfs benchmark at Columbia more than 1 day every five years. [or ?] • Meet all consumptive demands in the watershed [except during droughts of some quantifiable measure.] • DRA must select planning targets.
Summary of Decision Issues (2) All alternatives provide adequate to more than adequate supply reliability. Challenge: find the most economic way of adding increments of supply to meet reliability targets.
Summary of Decision Issues (3) Cost of new water supply created by alternative only can be amortized over new water required to meet targets. • Other purposes than water supply could absorb some costs not born by DRA. • Recreation or Water Quality. Costs of effects of not meeting DRA reliability targets are needed to set quantitative targets. • How much to spend depends on cost of missing target.