Download

1 / 1
10 likes | 126 Views
Evaporative Partitioning in a Unified Land Model Ben Livneh 1 , Dennis. P. Lettenmaier 1 , Pedro Restrepo 2 . 1) University of Washington Department of Civil and Environmental Engineering Box 352700, Seattle, WA 98195.

E N D
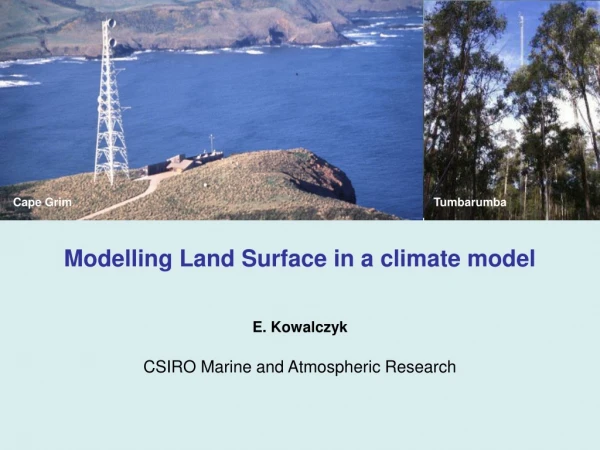
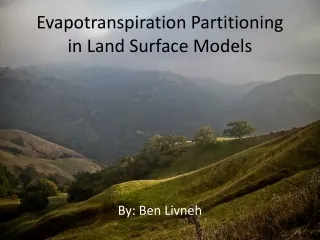
Evaporative Partitioning in a Unified Land Model Ben Livneh1, Dennis. P. Lettenmaier1, Pedro Restrepo2.1) University of Washington Department of Civil and Environmental Engineering Box 352700, Seattle, WA 98195. 2) NOAA National Weather Service Office of Hydrologic Development, Silver Spring, MD 20910-. Average monthly total ET (mm) during summer: 1980 – 1995 (JJA) ABSTRACT Preliminary sensitivity continued (surface energy exchange) Accurate partitioning of precipitation into evapotranspiration and runoff, and more generally estimation of the surface water balance, is crucial both for hydrologic forecasting and numerical weather and climate prediction. One important aspect of this issue is the partitioning of evapotranspiration into soil evaporation, canopy evaporation, and plant transpiration, which in turn has implications for other terms in the surface water balance. In the first part of the study, we tested several well known land surface models in multi-year simulations over the continental U.S. Among the models, which included the Variable Infiltration Capacity (VIC) model, the Community Land Model (CLM), the Noah Land Surface Model (Noah LSM), and the NASA Catchment model, there were substantial variations in the partitioning. These results motivated a more detailed evaluation, using data for two catchments that were a part of the second phase of the Distributed Model Intercomparison Project (DMIP-2), the East Fork Carson River Basin and the Illinois River Basin. In this portion of the study, we evaluated a unified land model (ULM) which is a merger of the NWS Sacramento Soil Moisture Accounting model (SAC-SMA; Burnash et al., 1975), which is used operationally for flood and seasonal streamflow prediction, and the Noah LSM (Mitchell et al., 2001, Ek et al., 2003), which is the land scheme used in NOAA’s suite of weather and climate prediction models. Our overall objective is to leverage the operational strengths of each model, specifically to improve streamflow prediction and soil moisture states within the Noah LSM framework, and to add a vegetation component to the SAC-SMA model. Partitioning of evapotranspiration into its three components is a key part of the ULM performance, and controls our ability to use calibrated SAC-SMA parameters within the ULM framework. In our evaluations at the DMIP-2 sites, we examined sensitivities of soil moisture and evaporative components in ULM to changes in vegetation cover, root zone depth, canopy interception capacity, and aerodynamic resistance. Using observations of evaporative fluxes above and below the canopy, we compare model performance and suggest physics upgrades to advance model performance. Snow-free albedo controls the amount of radiation reflected by the land surface, which is particularly relevant during the summer months. At both sites, increases in albedo effectively decrease radiation absorption at the surface and reduce ET processes, for which radiation is the main driver. Conversely, with higher albedos, more water reaches the soil and is retained. This results in higher surface runoff, baseflow and in turn, streamflow volume. Unlike sensitivities of other moisture-related parameters, this nearly supplementary relationship is nearly free of the effects of antecedent conditions. VIC Noah CLM SAC Catchment 2 Although differences certainly exist, total ET amongst models is very comparable on average. This is particularly significant, given the fairly diverse set of model parameterizations and assumptions in the computation individual components of model ET. JJA Streamflow (m3) JJA Evapotranspiration (mm) Fraction of total ET from soil evaporation during summer: 1980 – 1995 (JJA) 1 Snow-free albedo VIC Noah CLM SAC Catchment Under development – present and future work The most active area of development at this stage is in making improved estimates of model ET. Obtaining reliable observation data to validate model results has been challenging, however, the sites listed below provide adequate data as a starting point over a fairly robust cross-section of land cover types, including: (1) Mixed conifer-broadleaf forest, (2) Eucalypt woodland, (3) Arid Shrubland, (4) Savannah, and (5) Deciduous forest. Examining individual ET components reveals a noticable disparity between modeled quantities. Bare-soil evaporation, in this case is nearly zero for the VIC model since it is largely parameterized as having complete-vegetation coverage, while the SAC model derives all of its total ET from soil evaporation as it does not consider vegetation. CLM provides considerable throughfall which enables elevated soil evaporation in the West, while Noah follows a pattern consistent with its satellite-based monthly greenness maps, and the Catchment model shows artifacts of both greenness and leaf-area-index (LAI) patterns. Schematic of proposed model merger for ULM The merged model preserves the land surface components from the Noah model, including its: 1. snow model (Livneh et al., 2009); 2. snow and snow-free albedo formulations; 3. frozen soil scheme and soil heat flux terms; 4. vegetation parameterization (utilizing monthly greenness maps) and root layer distribution; and 5. Potential evapotranspiration computation. The SAC model contributes its conceptual soil moisture storage zones, with tension and free water zones that prescribe surface runoff, interflow and baseflow. The essential link between the models lies in how ET is extracted from the soil (through the vegetation roots and bare-soil). 5 4 3 + = Introduction and Motivation The major objective of this work is to develop a model that will make improved estimates of land surface and hydrological processes, through the merger of two models which are used operationally. Although the SAC model generally performs much better than Noah from a hydrologic prediction standpoint (Figure 1), it does not compute surface energy fluxes, and hence, cannot be run in a coupled mode with atmospheric models Albeit a vast amount of research has been done on parameter estimation for the SAC model, which could ideally be transferable to ULM. Additionally, recent improvements to the Noah snow (Livneh et al., 2009) model has made it more suitable to be coupled with atmospheric models, since accurate prediction of snow cover has a strong control over surface flux estimation and radiative partitioning. The motivation of this work therefore, is to establish a model that is well grounded in hydrology, while having the capability to also be run in the coupled-model environment. Selecting an appropriate ET scheme required careful consideration, as disparities exist among models (Figure2, Figure 3). The general breakdown of model structure is described in Figure 4. Sensitivity testing was done to further quantify the role of model interaction on land surface states and fluxes 2 1 Noah + SAC = ULM Preliminary sensitivity testing results from DMIP-2 test sites for summer months (JJA) The effect of greenness fraction and upper zone tension water shown here both influence runoff and ET. Greenness fraction controls canopy coverage, and hence intercepted moisture (up to a maximum) and partitioning of ET between vegetation and soil. Upper zone tension storage defines that depth of water which must be filled over non-impervious areas before streamflow in excess of the impervious response can occur. Its defecit also controls how much evaporation comes from the upper soil layers. For very low values this can lead to water limited conditions at (1), where very little precipitation falls during summer. References Burnash, R.J.C., 1995. The NWS river forecast system—catchment modeling. In: Singh, V.P. (Ed), Computer Models of Watershed Hydrology, Water Resources Publications, Highlands ranch, CO, pp. 311–366. Ek, M. B., K. E. Mitchell, Y. Lin, E. Rogers, P. Grunmann, V. Koren, G. Gayno, and J. D. Tarpley, 2003: Implementation of Noah land surface model advances in the National Centers for Environmental Prediction operational mesoscale Eta model, J. Geophys. Res., 108, 8851, doi:10.1029/2002JD003296. Livneh B, Xia Y, Mitchell KE, Ek MB, Lettenmaier DP (2009) Noah LSM Snow Model Diagnostics and Enhancements. Journal of Hydrometeorology: In Press Mitchell, K.E. et al., 2001: The Community Noah Land Surface Model (LSM) – User’s Guide (v2.2), available at http://www.emc.ncep.noaa.gov/mmb/gcp/noahlsm/README_2.2.htm. 1 2 2 2 JJA Streamflow (m3) JJA Evapotranspiration (mm) Map showing the two DMIP-2 basins of interest. Basin 1 is an alpine basin on the eastern-slope of the Sierra Nevada mountains (lat: 38.375; lon: -119.875; elev. 1800 m), while basin 2 is in the southern-central Great Plains region (lat: 35.875; lon: -95.125; elev. 330 m). (Figure 5, Figure 6). Current and future validation for ET partitioning is being done on several additional test sites (Figure 7). Noah SAC Observed 1 1 Peaks (ft3/s) Figure 1: Peaks-over-threshold analysis, showing the much improved streamflow prediction capability of SAC versus Noah; 30 year model simulations for the Colorado River above Grand Junction Upper-zone tension storage Greenness Fraction Cumulative Probability