Download
1 / 14
140 likes | 165 Views
Lessons for Our Future from Ages Ago. For the ratio of the global average ∆ º C to Vostok ∆ º C, I use 0.6, the ratio of global change to polar, over the last 2 million years, from Snyder (2016).

E N D
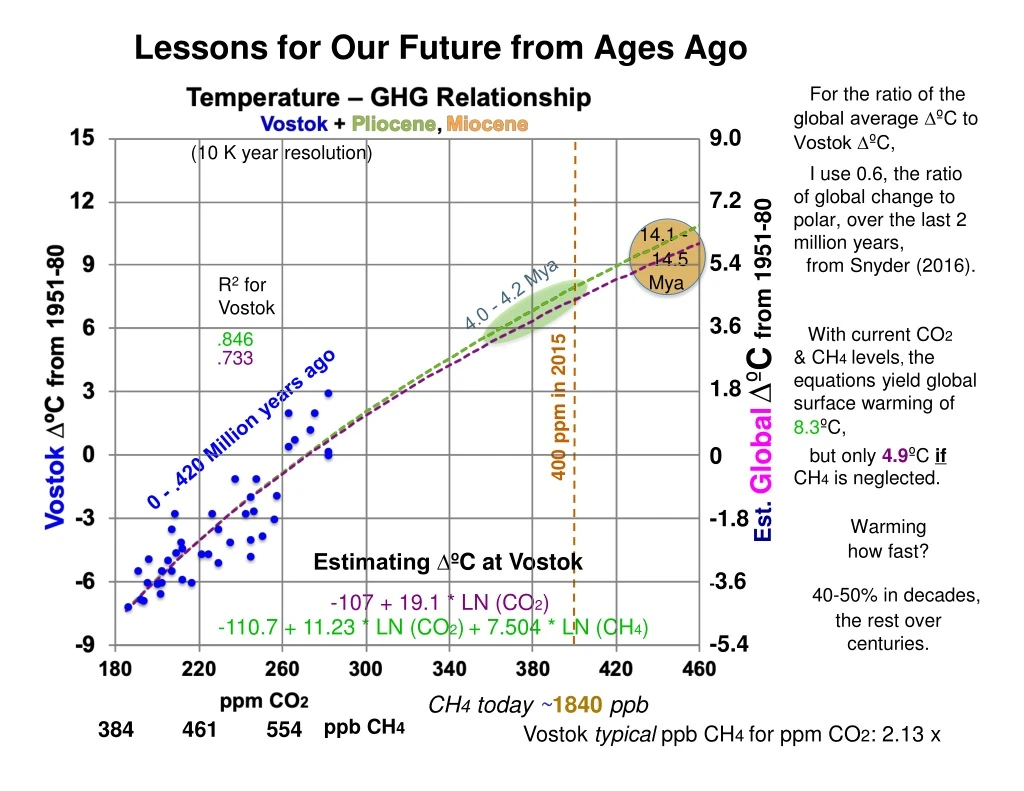
Lessons for Our Future from Ages Ago For the ratio of the global average ∆ºC to Vostok ∆ºC, I use 0.6, the ratio of global change to polar, over the last 2 million years, from Snyder (2016). With current CO2 & CH4levels,theequations yield global surface warming of 8.3ºC, but only 4.9ºC if CH4 is neglected. Warming how fast? 40-50% in decades, the rest over centuries. 9.0 7.2 5.4 3.6 1.8 0 -1.8 -3.6 -5.4 (10 K year resolution) 14.1 - 14.5 Mya R2 for Vostok 4.0 - 4.2 Mya .846 .733 Est. Global∆ºCfrom 1951-80 400 ppm in 2015 0 - .420 Million years ago Estimating ∆ºC at Vostok -107 + 19.1 * LN (CO2) -110.7 + 11.23 * LN (CO2)+ 7.504 * LN (CH4) CH4 today ~1840ppb ppb CH4 384 461 554 Vostok typical ppb CH4 for ppm CO2: 2.13 x
Take Carbon Outof the Air. , for $20-100/T. with no-till & compost cover. for $5-63 / T of CO2 removed. more soil carbon - stays eons, holds water. 1 T carbon / acre / year? with short rotationcattle grazing, like buffalo. so 75-90% of rain soaks in. Less soil moisture, forest fires soar. Few trees grow back. 1 Farming can put 4.3 GT CO2 /year in soils (0.7 in the US) Organic farms can add 1 T C /acre/yr to soil, Rebuild soil organic matter: from 1-3% now, to 6-10% before farming. 2Speed up rockweathering by grinding up basalt, olivine, peridotite. Sow olivine dust across the tropics, Add small olivine gravel to farming soils, for fertilizer & CO2 removal. 3 CaptureCO2 from air using amines in artificial leaves or ceramics, or using polyanthraquinone with battery charge-discharge: $20-70 / ton of CO2. Turn the CO2 into rock in concrete or basalt, or just store it underground. 4Farm the oceans. Grow algae in pans miles on a side, many inches deep. Harvest the algae, turn them into biochar. Sink the biochar (2+ g / cc). Or use open ocean, mangroves, kelp. Add fertilizer - Fe, also N, P, K, etc. 5 Bury biochar shallow in soil: 6 Rebuild rangelands with perennial grasses. Add soil carbon5 x faster Deep roots, dung beetles move carbon into soil, 7 Plant more trees.
CO2 Levels in the Air , • Up 47% highest level since 14-15 million years ago (430-465 ppm) Tripati ‘09 The deep ocean then was 10ºF or more warmer. Shevenell ‘08 Annual Averages Seas then were 80-130 feet higher. CO2 levels were almost as high (357-405 ppm) 4.0 to 4.2 million years ago. Sea surfaces then were ~ 7ºF warmer. Csank ’11, Dwyer ‘08 (40% Since 1880) Seas then were 65-120 feet higher. This means ice then was gone from almost all of Greenland, some of East Antarctica. most of West Antarctica, and 2/3 of West Antarctic ice is grounded below sea level. So is 1/3 in the East. Sediments show East Antarctic ice then retreated 100s of km inland. (CH4 up 114% since 1880) 300 ppm (maximum between ice ages) Vostok ice cores suggest a 8ºF warmer world at 400 ppm. 8ºF warmer world makes dry Kansas summers hotter than Las Vegas ones now. We face BIG lag effects. Current CO2 levels are already too high for us.
SulfateCooling Un-Smooths GHG Warming sulfates still 3 x 1880 levels NASA Pinatubo human 2016 sulfur emissions down 23% from 1979 peak +1.8ºC human sulfur emissions up 110% from 1940 to 1970 cool Agung Katmai + Santa Maria+ Krakatoa cool Predicted ∆°C = -20.48 + 2.089 * LN (CO2 ppm) + 1.252 * LN (CH4 ppb) - .00393 * SO4 ppb adjusted R2 = 98.3%. CO2, CH4 & SO4 (also 5-year averages (SO4 lag 1 year)) are all highly significant (|t| = 6.4 to 8.7). SO4 data includes industrial, occasional large volcanic, and other natural emissions. Averages: 80 (100 now) 8 (episodic) 30
I 1967-1990 +0.4 x 10²² Joules / year 1022 Joules = 100 yearsof US energy use, at 2000-13 rate 1991-2005 +0.7 / Heat Content (1022 Joules) 2006-2016 +1.0 / = 17 x human use acceleration By now, the oceans gain as much heat every 3 years as ALL the energy humans have EVER used.
• When Do State Summers Become as Hot as Las Vegas Now? New England 2322 2371 2145 The average of daily highs in Las Vegas, June 1 thru September 30, 1995-2015, was 100.1ºF. Dates shown assume LOCAL daily high trends for those 21 years CONTINUE. Trends use 21 years x 122 days, for 348 places. 2362 Dakotas 2245 2191 2287 2128 2567 2483 2086 2253 2348 2164 2315 2266 2252 2181 2108 2052 2149 MD-NJ-DE 2104 2096 2137 2194 2162 2169 2125 2129 2083 2097 2155 2140 2095 2135 2099 2101 2070 3649 2117 2235 2194
Notable Recent Droughts . When I was young, the leading wheat producers were the US Great Plains, Russia’s steppes, Canada, Australia, and Argentina’s Pampas. Notable Recent Droughts. WhenWhereHow Bad 2003 France, W Europe record heat 2003-10 Australia worst in 900 years. 2005 Amazon Basin once a century. 2007 Atlanta, US SE once a century 2007 Europe: Balkans record heat, Greek fires, ‘07-9 California record low rains. 2008-9 Argentina worst in half a century 2008-11 north China ~worst in 2 centuries. 2009 India Monsoon rain down 10-20% in N & C-E(1901-2012). 2010 Russia record heat, forest fires. 2011 Texas, Oklahoma record heat & drought 2012 US: SW, MW, SE most widespread in 78 years; record heat “Once a century” droughts are now happening once a decade. US #3 now China now #1 in wheat. hotter in 2012 , 20-70K die. Record heat in 2013. Worse in 2010 & esp. 2013-16. 1998-2012 Syria, Iraq, Jordan+ 10% worse than any other in 900 years hundreds die. Drought worst in 900+ years. ,‘13-15 Severe in Yunnan ‘09-13. #2 in wheat Wheat prices up 75%. 15K die.
• • By 2059, “Once a Century” Drought Can Cover 45% of Earth. 1969Supply-Demand Drought Index 1999. Business.. as Usual . Emissions.. 2029 2059 • • in 2059 2 x CO2 +4.2°C +14% rain Climate Model: NASA Goddard Institute for Space Studies (GISS) Fig. 1 in David Rind, R. Goldberg, James Hansen, Cynthia Rosenzweig, R. Ruedy, “Potential Evapotranspiration and the Likelihood of Future Droughts,”Journal of Geophysical Research, Vol. 95, No. D7, 6/20/1990, 9983-10004. DRY WET 0 1 5 16 36 36 16 5 1 0 % Occurrence in Control Run
• Droughts Are Spreading Already. Switch from what could happen to what has happened already. º º combined effect 30% = 16 million square miles 10 million more square miles Compare 2002 to 1979. 11% of the area during 1951-80: once per 9 years Area whererain is scarce increased by quite a bit: 3-6 million square miles. Evaporationincreased, by a lot since 1987. Compare 30% actualsevere drought area in 2002 (11% of the time during 1951-80) to 27% projected for 2000-2004 in previous slide. from Fig. 9 in Aiguo Dai, Kevin E. Trenberth, Taotao Qian [NCAR], "A Global Dataset of Palmer Drought Severity Index for 1870-2002: Relationship with Soil Moisture and Effects of Surface Warming.” Journal of Hydrometeorology, December 2004, 1117-1130 Droughts spread, as projectedor faster. Evaporation at work Earth’s area in severe droughthastripledsince 1979. Over 23 years, the area with severe drought grew by the size of North America.
Crop Yields Fall. United States: 2059 Projections - doubled CO2 - Business as Usual Great Lakes, Southeast, southern Great Plains Corn, Wheat, Soybeans 2 Climate Models (Scenarios) . NASA GISS Results Goddard Institute for Space Studies Yieldsfall30%, averaged across regions & crops. NOAA GFDL Results Geophysical Fluid Dynamics Lab Yieldsfall50%, averaged across regions & crops. CO2 fertilization not included . Temperature effects of doubled CO2 will growing to 4.2 or 4.5ºC after 2060, but continue to grow afterward, past 8ºC by 2400, as positive feedbacks continue to amplify direct effects. CO2fertilization (2 x CO2) boosts yields 4-34% in experiments, where water and other nutrients are well supplied, and weeds and pests are controlled. That won’t happen as well in many fields. Other factors (esp. nitrogen) soon limit growth, so CO2 fertilization will falter. Besides, with higher CO2, plants make more carbs but less protein. Rind et al., 1990 - 3 of the big 4 crops (rice is the 4th) (based on 4.2°C warmer, 14% more rain) (based on ~ 4.5°C warmer, 5% less rain)
2º vs 4° Warming . 1.2ºC warming is here. 2ºC warming is unavoidable, absent MASSIVE CO2 removal. Holding warming to 2ºC, not 4º, prevents these losses: 3/4 of Gross World Product $42 Trillion ~ 3/4 of GWP 1/5 of theWorld’s Food . 2/3 of the Amazon Rainforest 1/8 of the world’s oxygen supply Gulf Stream + West Antarctic Icecap . Florida & Louisiana, central CA, Long Island, Cape Cod 1/2 ofall Species . 4ºCwarming threatens civilization itself. Details to follow: first 2ºC, next 3ºC, then 4ºC, finally 5ºC. Emissions continue. 3ºC more is in the pipeline. - Norfolk area, much of 5ºCis worse.
• . . . The IEA says world CO2 output leveled off from 2013 to 2014 & . stayed flat in 2015-16. US DoE says it fell each year from 2012 to 2015. In 2013-14, China began CO2 cap & trade around its 7 largest cities. In 2014, China coalusefell,for the 1sttime in years: China’s CO2 output fell 4 straight years from 2012 to 2016, China’s CO2hit a peak in 2012. US CO2 fell 4% from 2014 to 2016, down by 15% since 2007 peak. World CO2 Emissionsfrom Fossil Fuels33.7 Billion Tons in 2015 * Misc. = Korea, Indonesia, Thailand, Taiwan, Malaysia, Vietnam, Bangladesh, etc. US DoE In 2015, itfell3% more. 2.9% from 2013. 4.2% in all.
even if we stop emitting now. Blame Earth will warm 3-4 x more, phasing out coal’s sulfur emissions (about .7ºF), vanishing polar sea ice (~1.1ºF), receding northern snow cover (~1.3ºF), receding Greenland & Antarctic ice (~.5ºF), warming oceans enough so energy out = in (~.3ºF), more H2O vapor & less cloud cover (1.68 multiplier). If carbon emissions don’t peak till 2035, add 2.9º from more CO2, 1.6 from snow, 1.8 from permafrost, 1.4 from H2O vapor & .8 from the other factors.
Soil carbon loss since 10,000 BC = 60% of fossil fuel emissions. Lal ‘01 Kansas is hot as Las Vegas is now CDR: CO2 removal = 32% of fossil fuel CO2 emissions to 2010. 2xCDR: remove 66% of FF CO2 emissions to 2010. includes big albedo effects: loss of sulfates, sea ice, some snow, cloud cover & land ice. More H2O in the air. International target 2100 2100 ppm CO2 from permafrost, etc. 450 339 220 142 66 54 S Florida, Norfolk, Sacramento Baton Rouge, Trenton under water includes thermal expansion & 86-99% ice loss (x CDR) In W. Antarctica, 74-96% (x CDR) in Greenland, & 7-35% (x CDR) in E. Antarctica. Composite Effects of 6 Scenarios . Composite Effects of 6 Scenarios .