Download
1 / 25
270 likes | 437 Views
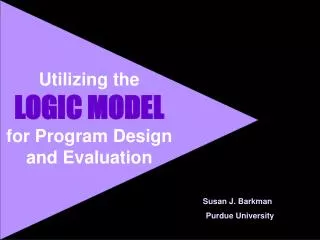
Utilizing the LOGIC MODEL for Program Design and Evaluation. Susan J. Barkman Purdue University .

E N D
Utilizing the LOGIC MODEL for Program Design and Evaluation Susan J. Barkman Purdue University
LOGIC MODEL - a graphic representation that shows the relationships between what we put in (inputs), what we do (outputs),and what results (outcomes)
IF THEN IF THEN IF THEN IF THEN INPUTS OUTPUTS OUTCOMES Program invests time & money Resource inventory can be developed Families will know what is available Families will access services Families will have needs met Logical Linkages:Series of If-Then Relationships
L O G I C M O D E L PROGRAM DESIGN AND PLANNING INPUTS OUTPUTS OUTCOMES - IMPACT Activities Participation LEARNING ACTION IMPACT What do we need to achieve our goals? What do we have to do to ensure our goals are met? Who needs to - participate - be involved? - be reached? What do we think the participants will know, feel or be able to do after the program? How do we think participants will behave or act differently after the program? What kind of impact can result if the participants behave or act differently? Workshops Meetings Camps Curriculum Publications Media Web site Projects Field Days Staff Volunteer Time Money Materials Equipment Technology Partners Number Characteristics Reactions Awareness Knowledge Attitudes Skills Aspirations Behavior Practice Decisions Policies Social Action Social Economic Civic Environmental MEASURING PROGRAM IMPACT
The originating condition Understanding the situation what is the underlying problem, causes, effects, who is involved? SITUATION - Needs Assessment
TARGETED OUTCOMES The “change in participants”you would expect to see as a result of participating in the program. what are the participants going to:know, feelor do different after the program
OUTCOMES LEARNING ACTION IMPACT What do we think the participants will know,feel or be able to do after the program? How do we think participants will behave or act differently after the program? What kind of impact can result if the participants behave or act differently? Awareness Created Knowledge Gained Attitudes Changed Skills Developed Aspirations Sparked Behavior Changed Practice Adopted Decisions Made Policies Changed or Adopted Social Action Initiated Social Impact Economic Impact Civic Impact Environmental Impact Susan Barkman- Purdue University
workshops meetings test plots & field days publications web site projects OUTPUTSActivities - What do we have to do to insure our goals are met? Susan Barkman- Purdue University
number characteristics reactions OUTPUTS Participation -Who needs to participate, be involved, be reached? Susan Barkman- Purdue University
staff volunteers time money materials equipment technology partners INPUTS-What do we need to achieve our goals? Susan Barkman- Purdue University
SO WHAT ! So how does this work in real work with children, youth and families?
1. Determine what OUTCOMES you want your program to achieve. • LEARNING OUTCOMES • Improve the science and math literacy of participants. • Develop a more positive attitude towards science, math and school in general in 80% of participants.
1. Determine what OUTCOMES you want your program to achieve. (continued) • ACTION OUTCOMES • Improve classroom behavior of Summer Intensive participants. • Improve the behavior of the parents towards their children.
2. Determine your OUTPUTS – who needs to participate and what are the components (activities) of the program.
First – 3rd grade students who have failed the ISTEP test or recommended by teacher Parent Helpers who will work 5 days/week (10 – 4pm) – need to be parents of participants Parents of participants will attend parenting classes PARTICIPATION
Summer Intensive Program 5 days (11-4pm) 100 contact hours Follow-up Group Meetings once a month through the rest of year (2-4 hours) 38 contact hours School Enrichment once a week, 45 minutes during school year 28.5 contact hours ACTIVITIES
Parent Helpers hire and train parents of SI classroom helpers Parenting Classes once a week for 6 weeks ACTIVITIES
3. Determine what INPUTS – are needed to make the program run.
Volunteers at least 3 volunteers per day in SI Parent Helpers 1 parent hired for every 5 youth in program (1:5 ) INPUTS
Project Director 1 FTE in summer months and .75 FTE in other months School Corporation helps recruit students, provides bus transportation and classroom space CES coordinates program and supervises Project Director INPUTS
NOW WHAT ! HOW DO I KNOW MY PROGRAM ACHIEVED IT’S OUTCOMES?
OUTCOME INDICATOR The observable, measurable characteristics or changes that represent achievement of an outcome. Susan Barkman- Purdue University
Outcomes Indicator - Improvement in science and math grades in Fall prior to SI program and in Fall after program Data Source- Report cards Outcome Indicator- participant is able to perform science process skills as observed by teacher Data Source – Science Observation Checklist Improve science and math literacy
Outcomes Indicator - Improvement in attitudinal score on pre/post assessment tool Data Source- Attitudinal Instrument Outcome Indicator- participant have a decrease in absenteeism from school year before and after program Data Source – School Attendance Records Develop a more positive attitude towards science, math and school in general
Logic Model Worksheet # 1 Checklist for Your Program Logic Model and Outcomes Outcome Indicator Worksheet # 2 Checklist for Outcome Indicators WORKSHEETS & CHECKLISTS